Conversion Performance Dashboard
The Conversion Performance Dashboard is your central hub for understanding how visitors discover, navigate, and convert on your website. By combining attribution modelling, journey analysis, and channel performance metrics, this dashboard reveals the complete story of your customer journeys—from first touch to final conversion.
What You'll Find on This Dashboard
The dashboard consists of three main areas:
Performance Metrics - Track your conversion success at a glance with key KPIs Journey Analysis - Understand how visitors navigate through your conversion paths Channel Attribution - Discover which marketing channels drive results and how they work together
All metrics use session-level counting, meaning a "converting session" is a visit that completed at least one conversion, counted once regardless of how many times it converted during that session. This methodology provides more accurate insights into visitor behaviour and aligns with analytics industry standards.
Dashboard Filters
Before diving into the data, you'll want to set your filters to focus your analysis:
Date Range - Choose from 7 to 120 days to analyse recent performance or identify longer-term trends
Domain - If you track multiple websites, select which one to analyse or view all domains combined
Path - Filter to a specific conversion goal (e.g., "Product Purchase" or "Newsletter Signup") or view all conversions together
Campaign - Isolate specific marketing campaigns using UTM parameters to measure campaign effectiveness
These filters apply across all dashboard components, allowing you to slice your data consistently throughout your analysis.
Key Performance Indicators
Conversion KPIs
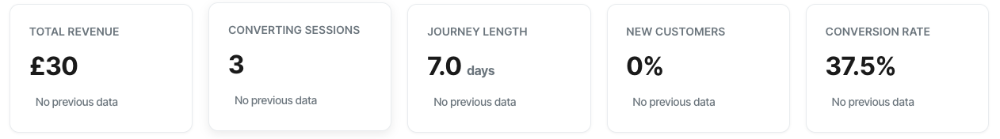
Five essential metrics provide an at-a-glance view of your conversion performance:
- Total Revenue - The monetary value generated from all conversions
- Converting Sessions - The number of visits that resulted in a conversion
- Journey Length - Average days from first touch to conversion
- New Customers - Percentage of conversions from first-time customers
- Conversion Rate - The percentage of sessions that converted
Each metric includes a trend indicator comparing your current period to the previous one, helping you quickly spot improvements or issues requiring attention.
Path Performance Analysis
Path Conversion Rate Trend
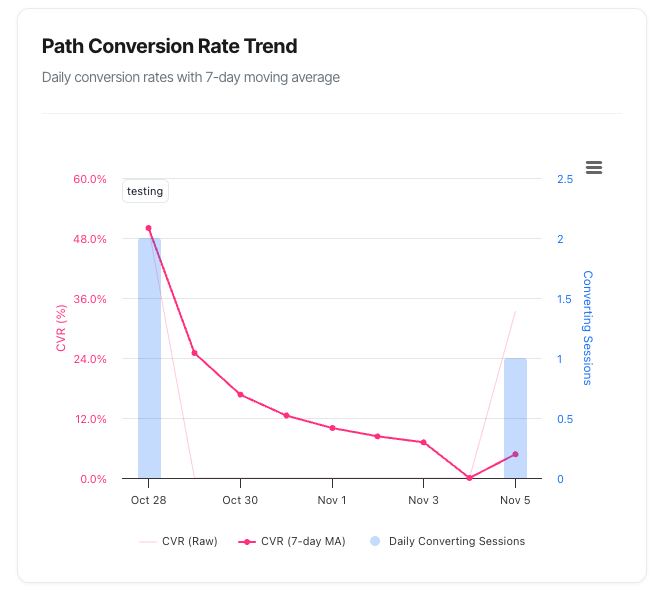
Track your conversion rate over time with a line chart showing daily performance. The chart displays both raw daily rates and a smoothed 7-day moving average to help you distinguish genuine trends from random variation. This is essential for measuring the impact of website changes, campaigns, or seasonal patterns.
Conversion Path Flow
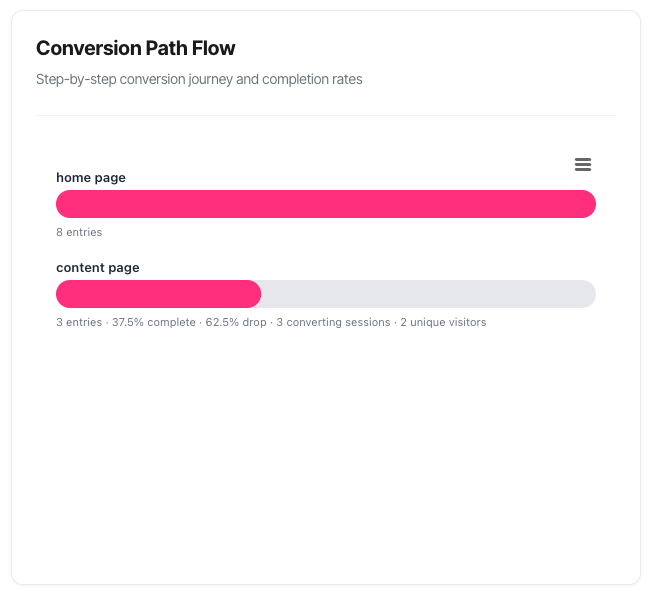
A visual funnel showing exactly how visitors progress through your conversion path. See at a glance where people succeed and where they drop off, with detailed metrics for entries, completions, and drop-off rates at each step. This is your primary tool for identifying friction points in your conversion process.
Channel Performance & Attribution
Channel Performance Table
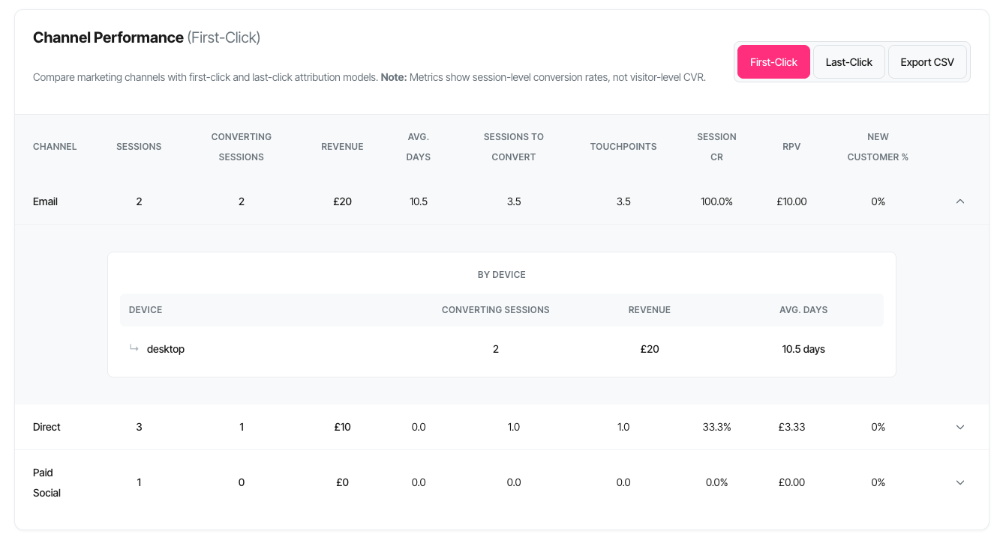
A comprehensive breakdown of every marketing channel driving traffic to your website. Compare channels across key metrics including sessions, conversions, revenue, and efficiency measures like conversion rate and revenue per visit. Toggle between First-Click and Last-Click attribution to understand which channels excel at customer acquisition versus closing sales.
Campaign Performance Table
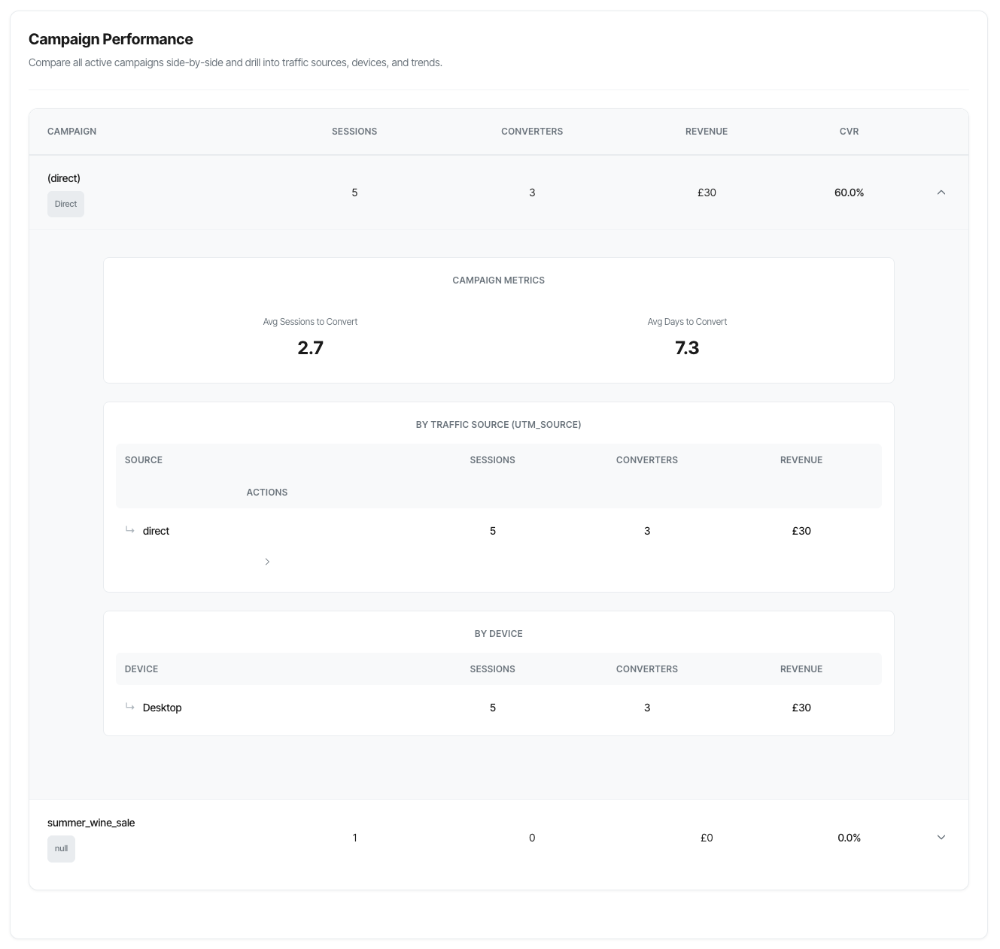
Drill down to the campaign level to see which specific marketing initiatives drive conversions. View performance across traffic sources, devices, and UTM parameters. The expandable rows reveal detailed breakdowns, helping you identify your best-performing campaigns and optimise budget allocation.
First-Click vs Last-Click Attribution
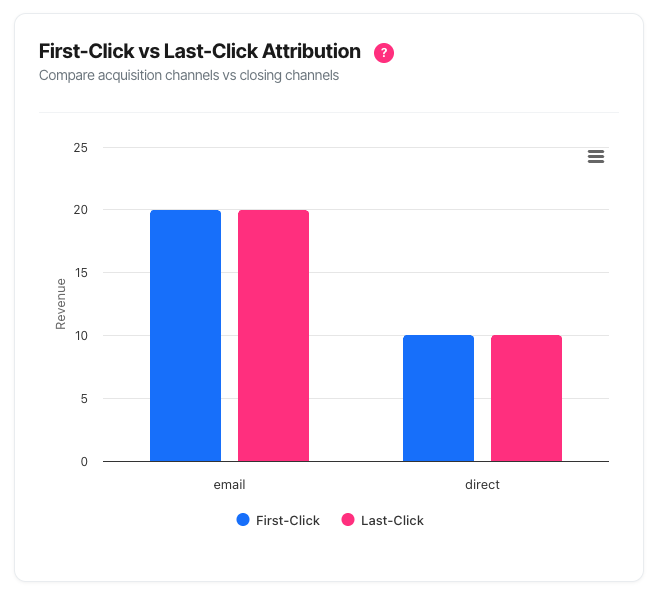
A side-by-side comparison revealing which channels are best at starting customer journeys versus closing sales. This butterfly chart helps you understand channel roles in your marketing mix and avoid the common mistake of cutting effective awareness channels that don't show up in last-click attribution.
Top Conversion Paths

Discover the actual channel sequences your customers follow before converting. Instead of crediting a single channel, this analysis shows complete journeys with every marketing touchpoint along the way. Expandable rows reveal device breakdowns and channel frequency, helping you understand how channels work together to drive conversions.
Journey Analysis
User Journey Flow
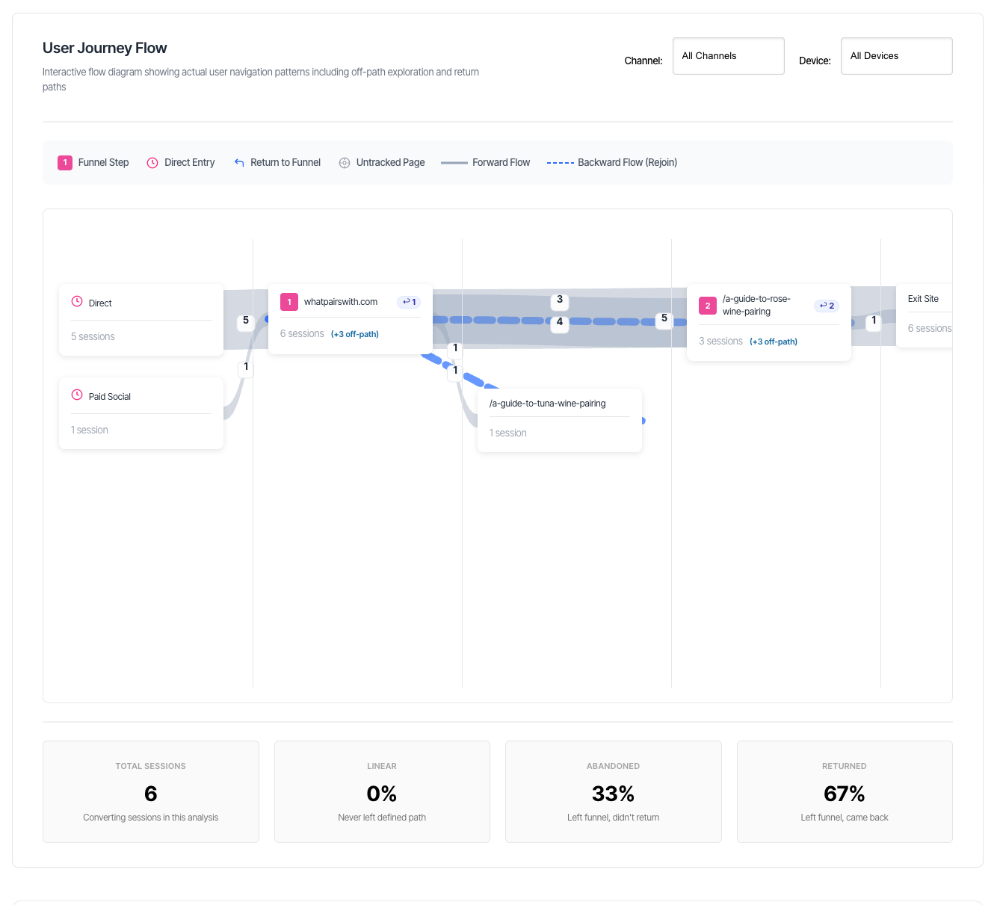
An interactive visualisation revealing the navigation patterns of your visitors, including when they explore pages outside your defined conversion path and whether they return. Unlike a simple funnel, this diagram shows the messy reality of how people browse your site, complete with exploration zones and return paths that help you optimise the full customer experience.
Journey Start vs Conversion Device
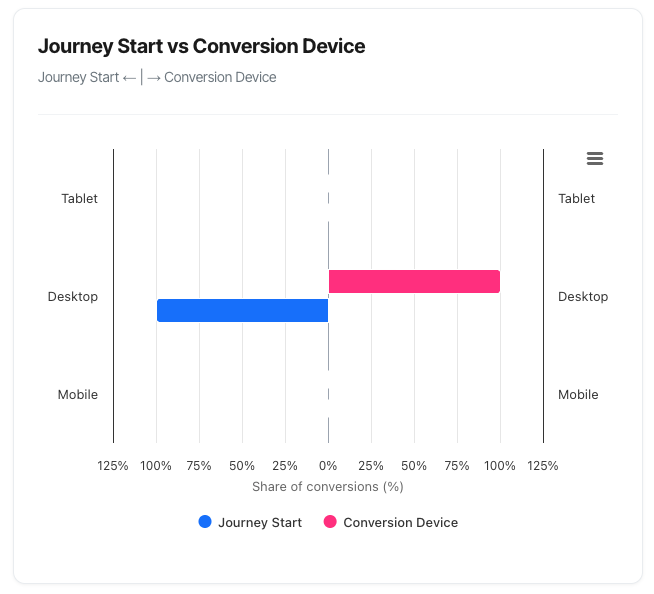
A butterfly chart showing which devices visitors use when they first discover you versus which devices they ultimately use to convert. This reveals device-switching behaviour that's critical for optimising cross-device experiences. Many customers discover products on mobile but convert on desktop—or vice versa.
Sessions to Conversion Distribution
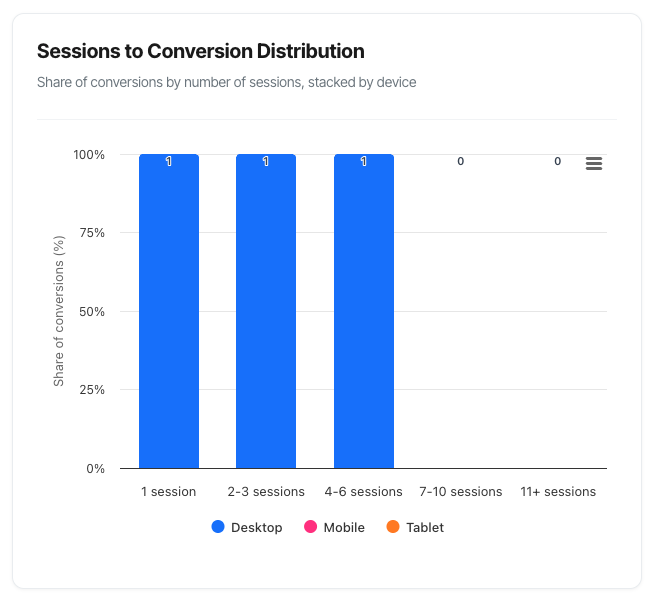
Understand how many visits it takes for customers to convert with a stacked column chart showing distribution across journey lengths (1 session, 2-3 sessions, 4-6 sessions, etc.). The device breakdown within each column reveals whether mobile users need more sessions than desktop users, informing your remarketing windows and email sequences.
Days to Conversion Distribution
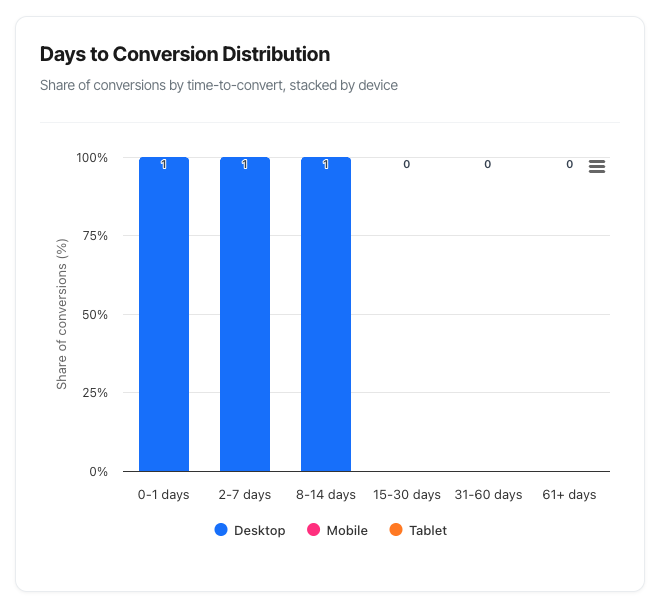
Similar to the sessions distribution, but measuring time rather than visit count. See how many customers convert within 24 hours versus those requiring weeks of consideration. This helps you plan remarketing campaign duration, email nurture sequences, and understand whether you're capturing impulse purchases or considered buying decisions.
How to Use This Dashboard Effectively
Start with the KPIs to understand overall performance and identify areas requiring investigation. A declining conversion rate or increasing journey length signals issues that need attention.
Use Path Flow and Journey Flow together to understand both the intended path (Path Flow) and actual visitor behaviour (Journey Flow). The gap between them reveals opportunities for improvement.
Compare attribution models to avoid misallocating budget. A channel showing high first-click but low last-click attribution is your customer acquisition engine—cutting it would damage channels that appear strong in last-click attribution.
Segment by device and campaign to identify where your strongest opportunities lie. Often, one device or campaign drives disproportionate results, revealing where to focus optimisation efforts.
Look for patterns over time using the trend charts. One-day spikes or drops are usually noise; consistent trends over 7-14 days indicate genuine changes requiring action.
Cookie Tracking vs Cookieless Mode
Several dashboard components adapt based on your domain's tracking configuration:
Cookie Tracking Mode provides complete journey analysis including cross-session attribution, visitor tracking, and detailed path analysis. You'll see all metrics and features.
Cookieless Mode focuses on privacy-compliant, aggregate data with session-level insights. Some features like cross-session journey metrics and attribution models are limited or hidden.
You can check and modify your tracking mode in the manage tracking sessions settings.
Common Use Cases
Measuring marketing ROI - Use Channel Performance and Campaign Performance tables with attribution comparison to understand which marketing investments drive genuine business results.
Optimising conversion funnels - Combine Path Flow (to spot drop-offs) with Journey Flow (to understand where people go) and Session Replay (to see why they leave) for comprehensive funnel optimisation.
Understanding customer behaviour - Use the distribution charts (Sessions to Conversion, Days to Conversion) along with Journey Flow to understand how customers research and make decisions, then align your marketing accordingly.
Budget allocation - Compare First-Click vs Last-Click attribution across channels to build a balanced marketing mix that covers both customer acquisition and closing.
Device optimisation - Use Journey Start vs Conversion Device and session distribution breakdowns to identify device-specific issues and opportunities.
Getting Started
- Set your date range to 30 days for reliable baseline data
- Review the Conversion KPIs to understand overall performance
- Check the Path Flow to identify any obvious friction points
- Examine Channel Performance to see where your traffic originates
- Use attribution comparison to understand channel roles
- Dive into specific areas using the journey analysis tools
For detailed guidance on any component, click through to the linked articles. Each provides comprehensive explanations, examples, and troubleshooting advice.
Note: All timestamps and metrics update automatically based on your selected filters. Data is typically processed within a few hours of conversion events occurring. If you notice discrepancies or have questions about specific metrics, consult the detailed guides linked above or contact support.