Campaign Performance Table
The Campaign Performance table provides a complete view of how each marketing campaign drives conversions. By comparing all your active campaigns side-by-side, you can quickly identify your best performers, understand which traffic sources and devices work best, and make data-driven decisions about where to invest your marketing budget.
What You'll See
The Campaign Performance table displays:
- A sortable table with all campaigns that drove traffic during your selected time period
- Key metrics for each campaign: sessions, converting sessions, revenue, and conversion rate
- Channel indicators showing the primary traffic channel for each campaign
- Expand buttons (►) to reveal detailed breakdowns
- Drill-down capabilities to explore traffic sources, mediums, and ad creatives
The table updates automatically when you change your filters, giving you instant insights into campaign performance.
Understanding the Table Columns
Campaign Name
What it shows: The name of the marketing campaign, taken from the utm_campaign parameter in your tracking URLs.
Special cases:
- (direct): Traffic that came directly to your site without a campaign parameter
- May include campaign names from various platforms: Google Ads, Facebook, email campaigns, affiliate programs, etc.
Below the name: A badge indicating the primary channel (e.g., "Paid Search", "Email", "Social")
Example:
Summer Sale 2025 Paid Search
What this tells you: This campaign is primarily driven by paid search advertising (e.g., Google Ads).
Sessions
What it shows: The total number of website visits attributed to this campaign using first-touch attribution.
Important: This uses first-touch attribution, meaning a session is credited to whichever campaign brought the visitor to your site for the first time during the tracking window.
Example:
1,247 sessions
What this tells you: This campaign drove 1,247 visits to your website.
Why it matters: Higher session counts mean more traffic, but quality matters more than quantity. A campaign with 10,000 sessions and 1% conversion rate might be less valuable than one with 1,000 sessions and 10% conversion rate.
Converters (Converting Sessions)
What it shows: The number of sessions that completed at least one conversion, counted once per session regardless of how many conversions occurred.
Important details:
- Uses session-level counting (aligned with your KPI dashboard)
- One session counted once even if it had multiple conversions
- Attributed to the first-touch campaign that brought the visitor
Example:
127 converters
What this tells you: 127 sessions from this campaign resulted in at least one conversion.
Not shown in the table (but available in details):
- Conversion events: Total number of conversion actions (may be higher if sessions converted multiple times)
- Unique visitors: Individual people who converted (may be lower if visitors returned to convert again)
Revenue
What it shows: The total monetary value generated by conversions attributed to this campaign.
Currency display: Automatically shows the appropriate symbol (£, $, €, etc.) based on your path configuration.
Example:
£8,450
What this tells you: This campaign generated £8,450 in conversion value.
Why it matters: This is your return on ad spend (ROAS) numerator. Compare this to your campaign costs to calculate profitability.
CVR (Conversion Rate)
What it shows: The percentage of sessions that converted.
Formula: (Converting Sessions ÷ Total Sessions) × 100
Example:
10.2%
What this tells you: 10.2% of sessions from this campaign resulted in a conversion.
Interpretation:
- Below 2%: Poor campaign performance or wrong audience
- 2-5%: Average performance
- 5-10%: Good performance
- Above 10%: Excellent performance (or very targeted audience)
Remember: Industry averages vary widely. Focus on improving YOUR baseline and comparing campaigns against each other.
Expand Button (►)
What it does: Reveals detailed breakdowns for the campaign including:
- Campaign-level metrics (journey insights)
- Traffic source breakdown
- Device breakdown
- UTM drill-down capabilities
How to use: Click the ► button to expand, click again (now ▼) to collapse.
Primary Channel Badges
Below each campaign name, you'll see a coloured badge indicating the primary traffic channel:
Paid Search (Purple)
- Google Ads, Bing Ads
- Keywords driving paid traffic
- Typically high-intent visitors
Organic Search (Green)
- Google organic, SEO traffic
- Non-paid search results
- Often lower cost per acquisition
Social (Blue)
- Facebook, Instagram, LinkedIn, Twitter
- Community-driven traffic
- Varies widely in quality
Email (Orange)
- Newsletter campaigns, promotional emails
- Typically high engagement
- Existing relationship with visitors
Direct (Grey)
- Typed URL, bookmarks, unknown source
- Includes some mobile app traffic
- Hard to attribute specifically
Paid Social (Light Blue)
- Facebook Ads, Instagram Ads, LinkedIn Ads
- Targeted social advertising
- Often used for awareness and remarketing
Display (Yellow)
- Banner ads, native advertising
- Programmatic advertising
- Typically lower conversion rates but good for awareness
Referral (Teal)
- Links from other websites
- Affiliate programs, partnerships
- Quality varies by referring site
Why this matters: The primary channel gives you quick context about the campaign's traffic composition. A "Paid Search" campaign should perform differently than a "Social" campaign.
How First-Touch Attribution Works
Critical to understand: All metrics in the Campaign Performance table use first-touch attribution.
What Is First-Touch Attribution?
Simple explanation: The campaign that brought someone to your site for the very first time gets credit for any conversions that session makes.
Example journey:
- Monday: Sarah clicks a Google Ad (Campaign: "Spring Sale") → Browses but doesn't buy
- Tuesday: Sarah types your URL directly → Browses again
- Wednesday: Sarah clicks email link (Campaign: "Welcome Series") → Makes a purchase
Attribution result:
- "Spring Sale" campaign gets credit for the conversion (first touch)
- "Welcome Series" campaign gets no conversion credit
- Both campaigns show session counts for when Sarah visited
Why first-touch?
- Credits the campaign that brought the visitor in the door
- Values customer acquisition
- Pairs well with conversion rate optimisation
- Different from last-touch (which would credit "Welcome Series")
Path Mode vs Site-Wide Mode
Path Mode (when you've selected a specific conversion path):
- Sessions must have entered at Step 1 of your selected path
- Credited to the first-touch campaign that brought them
- More specific, focuses on that conversion funnel
Site-Wide Mode (no path selected):
- All sessions with conversions across any path
- Broader view of campaign performance
- Useful for overall campaign comparison
Reading the Table
Sorting and Prioritisation
Default sort: By converting sessions (descending), then revenue
What this means: Your best-performing campaigns appear at the top.
To prioritise differently:
- Click column headers to sort (if sortable)
- Or export data and sort in Excel/Google Sheets
Quick Scanning Strategy
Step 1: Look at the top 3 campaigns
- These are your star performers
- Understand what makes them successful
- Consider increasing budget here
Step 2: Look at the bottom 3 campaigns
- These need improvement or may need pausing
- Investigate why they're underperforming
- Consider if they serve a different purpose (awareness vs conversion)
Step 3: Find anomalies
- High sessions, low converters = traffic quality issue
- Low sessions, high CVR = underinvested winner
- High revenue, low CVR = high-value but inefficient
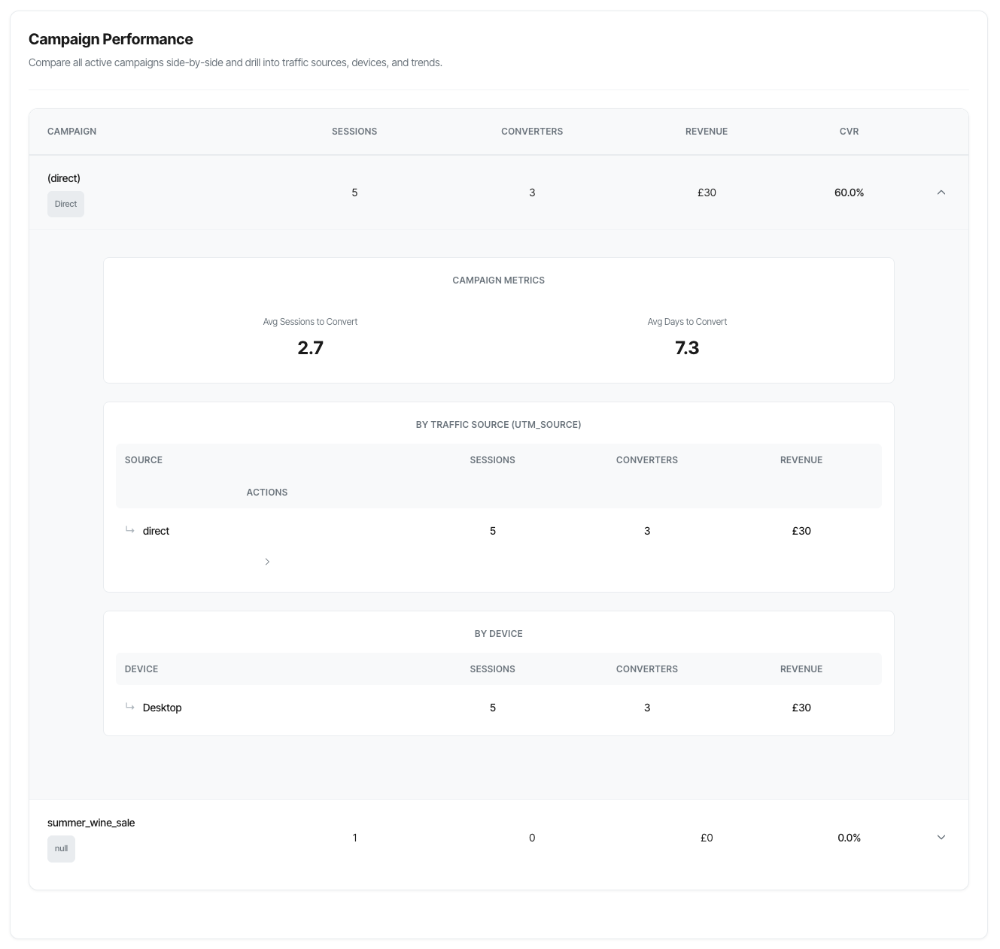
Expanded Campaign Details
When you click the expand button (►), you see three main sections:
1. Campaign Metrics
Displays:
- Avg Sessions to Convert: How many visits, on average, before someone converts
- Avg Days to Convert: How many days from first visit to conversion
- Top Path: (if applicable) Most common conversion path
Example:
Avg Sessions to Convert: 2.3 Avg Days to Convert: 4.5
Interpretation:
- Sessions = 2.3: Visitors from this campaign typically need 2-3 visits before converting
- Days = 4.5: The decision process takes about 4-5 days
- This is a "considered purchase" campaign, not impulse buying
2. By Traffic Source (utm_source)
What it shows: Breakdown by utm_source parameter (e.g., google, facebook, newsletter)
Table columns:
- Source: The traffic source name
- Sessions: Total visits from this source
- Converters: Converting sessions from this source
- Revenue: Money generated by this source
- Actions: Drill-down button (►) to explore mediums
Example:
| Source | Sessions | Converters | Revenue | Actions |
|---|---|---|---|---|
| 847 | 92 | £7,245 | ► | |
| bing | 234 | 18 | £1,520 | ► |
| 166 | 17 | £685 | ► |
How to read this:
- Google is your primary traffic source for this campaign (847 sessions)
- Google also has the best conversion volume (92 converters)
- But compare conversion rates: Google = 10.9%, Bing = 7.7%, Facebook = 10.2%
- Google and Facebook have similar efficiency, Bing is slightly lower
3. By Device
What it shows: Breakdown by device type (Mobile, Desktop, Tablet)
Table columns:
- Device: Type of device
- Sessions: Total visits from this device
- Converters: Converting sessions from this device
- Revenue: Money generated by this device
Example:
| Device | Sessions | Converters | Revenue |
|---|---|---|---|
| Mobile | 682 | 54 | £4,120 |
| Desktop | 432 | 58 | £3,670 |
| Tablet | 133 | 15 | £660 |
How to read this:
- Mobile drives most traffic (682 sessions)
- But Desktop has better conversion rate: 58/432 = 13.4% vs Mobile: 54/682 = 7.9%
- Tablet is present but lower volume
UTM Drill-Down Functionality
The power feature: Drill into campaigns at multiple levels to find exactly what's working.
Drill-Down Hierarchy
Campaign └── Source (utm_source) └── Medium (utm_medium) └── Content/Creative (utm_content)
How to Use Drill-Down
Step 1: Start with source
- In the "By Traffic Source" section, click the ► button next to any source
- This opens the Medium drill-down
Step 2: Explore mediums
- See breakdown by utm_medium (cpc, cpm, email, organic, etc.)
- Shows sessions, conversions, revenue, CVR for each medium
- Identify which medium performs best for that source
Step 3: Drill into creatives (optional)
- Click ► next to any medium
- See breakdown by utm_content (ad creative, email version, etc.)
- Find your best-performing creative
Step 4: Close drill-down
- Click the ✕ in top-right to close
- Returns to campaign breakdown view
Example Drill-Down Journey
Campaign: "Spring Sale 2025"
Level 1 - Source breakdown:
google: 847 sessions, 92 converters (10.9% CVR) ► [click to drill]
Level 2 - Medium breakdown (for google):
Breadcrumb: Campaign: Spring Sale 2025 → Source: google cpc (Cost Per Click): 654 sessions, 78 converters (11.9% CVR) ► [click to drill] organic: 193 sessions, 14 converters (7.3% CVR) ► [click to drill]
Level 3 - Content breakdown (for google / cpc):
Breadcrumb: Campaign: Spring Sale 2025 → Source: google → Medium: cpc ad-variant-a: 389 sessions, 52 converters (13.4% CVR) ⭐ ad-variant-b: 265 sessions, 26 converters (9.8% CVR)
Insight gained:
- Google CPC is your best medium (11.9% CVR)
- Ad variant A dramatically outperforms variant B (13.4% vs 9.8%)
- Action: Shift budget to variant A, investigate what makes it better
Practical Use Cases
1. Identifying Your Best Campaigns
Scenario: You're running 12 different campaigns and need to know where to focus.
How to use Campaign Performance:
- Review the table sorted by converters
- Top 3 campaigns are your immediate focus
- Note their conversion rates too (high converters + high CVR = winner)
- Look for efficiency vs volume
- Campaign A: 5,000 sessions, 200 converters (4% CVR)
- Campaign B: 500 sessions, 75 converters (15% CVR)
- Campaign B is far more efficient despite lower volume
- Calculate return on investment
- Revenue per campaign ÷ Campaign cost = ROI
- Example: £8,450 revenue ÷ £2,000 spend = 4.2× ROI (excellent!)
2. Diagnosing Underperforming Campaigns
Scenario: A campaign has high traffic but low conversions.
Example:
Campaign: "Budget Deals" Sessions: 3,247 Converters: 32 (0.98% CVR) Revenue: £680
Diagnostic process:
- Expand the campaign details
- Look at "By Traffic Source"
- Is one source dragging everything down?
- Check device breakdown
- Is mobile converting at 2% but desktop at 8%?
- Mobile experience might be broken
- Use UTM drill-down
- Find which specific source + medium combination performs worst
- Example: facebook / cpm might be 0.3% CVR (awareness traffic)
- While google / cpc is 3.2% CVR (intent traffic)
- Review campaign metrics
- Avg Sessions to Convert: 1.2 (they're deciding fast or bouncing)
- Avg Days to Convert: 0.8 (same-day decisions)
- This suggests impulse OR wrong audience
Likely causes:
A. Wrong audience targeting
- Traffic not interested in your offer
- Mismatched messaging
- Fix: Review targeting, refine audience
B. Traffic quality issues
- Bot traffic, accidental clicks
- Fix: Exclude low-quality placements
C. Landing page problems
- Slow loading, confusing layout
- Mobile experience broken
- Fix: A/B test landing pages, improve mobile
D. Price or value mismatch
- "Budget" promise not met
- Too expensive for the expectation set
- Fix: Align ad messaging with actual offer
3. Optimising Budget Allocation
Scenario: You have £10,000 monthly budget to split across campaigns.
Current allocation (equal split):
| Campaign | Budget | Sessions | Converters | CVR | Revenue |
|---|---|---|---|---|---|
| Campaign A | £2,500 | 1,200 | 48 | 4.0% | £4,200 |
| Campaign B | £2,500 | 450 | 68 | 15.1% | £8,500 |
| Campaign C | £2,500 | 3,400 | 68 | 2.0% | £3,100 |
| Campaign D | £2,500 | 890 | 18 | 2.0% | £1,800 |
Analysis:
Campaign B: Efficiency winner
- Highest CVR (15.1%)
- Highest revenue (£8,500) with lowest traffic
- Clearly underinvested
- ROI: 3.4× (£8,500 / £2,500)
Campaign C: Volume play
- High traffic but low efficiency
- Might be valuable for brand awareness
- ROI: 1.24× (barely profitable)
Campaign D: Poor performer
- Low traffic, low efficiency, low revenue
- ROI: 0.72× (losing money)
Campaign A: Average
- Middle of the road
- ROI: 1.68× (decent)
Optimised allocation:
| Campaign | New Budget | Expected Converters | Expected Revenue | ROI |
|---|---|---|---|---|
| Campaign B | £5,000 | ~136 | ~£17,000 | 3.4× |
| Campaign A | £3,000 | ~58 | ~£5,040 | 1.68× |
| Campaign C | £2,000 | ~54 | ~£2,480 | 1.24× |
| Campaign D | £0 | 0 | £0 | — |
Result:
- Total revenue increases from £17,600 to ~£24,520 (+39%)
- Average ROI improves from 1.76× to 2.45×
- Freed £2,500 from Campaign D to reinvest
4. Seasonal Campaign Comparison
Scenario: You run seasonal campaigns and want to compare them year-over-year.
Example:
Summer Sale 2024:
- Sessions: 8,450
- Converters: 423 (5.0% CVR)
- Revenue: £28,400
Summer Sale 2025:
- Sessions: 6,890
- Converters: 552 (8.0% CVR)
- Revenue: £35,200
Analysis:
Traffic decreased (-18.5%)
- Fewer sessions but better quality
- Possible causes: Better targeting, market competition, budget changes
Efficiency improved (+60%)
- CVR jumped from 5.0% to 8.0%
- Revenue increased despite lower traffic
- Better messaging, improved site experience, or better audience fit
Revenue increased (+24%)
- Net positive result
- £35,200 vs £28,400 = £6,800 more revenue
Dive deeper with breakdown:
- Compare source breakdowns
- Did google perform better year-over-year?
- Did facebook drop in volume?
- Compare device performance
- Mobile conversion improved?
- Desktop maintained quality?
- Use drill-down
- Which creative variations worked best in 2025?
- Replicate those for next season
5. Multi-Channel Campaign Strategy
Scenario: Running an integrated campaign across multiple channels (Google, Facebook, Email) and need to understand how they work together.
Campaign name: "New Product Launch"
Main table shows:
- Total sessions: 4,580
- Converters: 367 (8.0% CVR)
- Revenue: £24,600
Expand to see source breakdown:
| Source | Sessions | Converters | CVR | Revenue |
|---|---|---|---|---|
| 2,340 | 187 | 8.0% | £12,540 | |
| 1,480 | 98 | 6.6% | £6,860 | |
| newsletter | 560 | 58 | 10.4% | £4,320 |
| 200 | 24 | 12.0% | £880 |
Insights:
Google: Workhorse
- Highest volume, solid efficiency
- Pays the bills, reliable performance
Newsletter: Efficiency champion
- Lowest volume but highest CVR (10.4%)
- Engaged, warm audience
- Opportunity: Grow email list
Instagram: Hidden gem
- Small volume but excellent CVR (12.0%)
- Highly engaged audience
- Opportunity: Test increased spend
Facebook: Volume play
- Second highest volume, decent CVR
- Good for awareness and remarketing
- Acceptable performance
6. Device-Specific Optimisation
Scenario: Your campaign shows poor mobile conversion.
Campaign: "Premium Services"
Device breakdown shows:
| Device | Sessions | Converters | CVR | Revenue |
|---|---|---|---|---|
| Desktop | 890 | 98 | 11.0% | £14,560 |
| Mobile | 2,340 | 82 | 3.5% | £4,920 |
| Tablet | 156 | 12 | 7.7% | £840 |
Problem identified:
- Mobile has 2.6× the traffic but converts at 1/3 the rate (3.5% vs 11.0%)
- Mobile revenue per session: £2.10
- Desktop revenue per session: £16.36
- Huge opportunity: If mobile matched desktop CVR, you'd gain ~£20,000 revenue!
Investigation steps:
- Use your phone to complete the journey
- Is the site slow on mobile?
- Are forms difficult to fill?
- Is checkout confusing?
- Are buttons too small?
- Check mobile-specific sources
- Use UTM drill-down filtered by device type
- Are certain mobile traffic sources (Instagram Stories, Facebook Feed) performing worse?
- Review campaign metrics for mobile
- Avg Sessions to Convert might be higher (multi-session path difficult on mobile)
- Avg Days to Convert might be longer (start on mobile, finish on desktop)
7. UTM Drill-Down for Creative Testing
Scenario: You're running A/B tests on ad creatives and need to know which performs best.
Campaign: "Q4 Sale"
Start with source: Google
Drill down to medium: CPC (cost per click)
Drill down to content:
| Content (Creative) | Sessions | Conversions | CVR | Revenue |
|---|---|---|---|---|
| hero-lifestyle | 1,240 | 136 | 11.0% | £9,520 |
| hero-product | 980 | 78 | 8.0% | £5,460 |
| hero-discount | 650 | 39 | 6.0% | £2,730 |
Clear winner: Hero-lifestyle creative
- Highest volume (1,240 sessions)
- Highest CVR (11.0%)
- Highest revenue (£9,520)
Analysis:
Why lifestyle beats product:
- Emotional connection vs features
- Shows product in use vs static shot
- Aspirational vs transactional
Why both beat discount:
- Discount creative attracts price-sensitive buyers
- Lower intent, lower conversion
- May be cannibalising full-price sales
Understanding Campaign Metrics
When you expand a campaign, the metrics section provides valuable journey insights:
Avg Sessions to Convert
What it measures: How many times, on average, a visitor needs to visit your site before converting.
Ranges and meanings:
1.0-1.5 sessions: Quick deciders
- Impulse purchases
- Clear value proposition
- Simple offering
- Low-risk decision
1.5-3.0 sessions: Standard consideration
- Normal B2C behavior
- Comparing options
- Reading reviews
- Typical e-commerce
3.0-5.0 sessions: Extended research
- Complex products
- Higher price points
- B2B considerations
- Requires more touchpoints
5.0+ sessions: Long sales cycle
- Major purchases
- High involvement
- Multiple stakeholders
- Needs nurture campaign
What to do with this:
If sessions are high:
- Improve clarity of value proposition
- Add more trust signals
- Simplify decision-making
- Consider if you're attracting wrong audience
If sessions are low:
- Your campaign and site are aligned
- Message matches audience expectation
- Conversion path is clear
- Consider: Can you replicate this for other campaigns?
Avg Days to Convert
What it measures: How many days pass, on average, between a visitor's first visit and their conversion.
Ranges and meanings:
0-1 days: Impulse or urgent need
- Same-day decisions
- Strong immediate need
- Well-timed campaigns
- Flash sales, limited offers
1-3 days: Quick research
- Weekend consideration for weekday ads
- Single research session
- Comfortable with brand
3-7 days: Standard consideration
- Typical for many products
- Comparing alternatives
- Waiting for payday
- Building confidence
7-14 days: Extended deliberation
- Higher involvement
- Multiple comparison sessions
- May be comparing offline too
- Budget planning
14-30+ days: Long sales cycle
- Major life purchases
- Complex B2B
- Multiple stakeholders
- Careful consideration
Troubleshooting
Issue: No Campaigns Showing
Symptom: Table is empty or says "No campaigns found"
Possible causes:
- No UTM tracking in your campaigns
- Check if your URLs have utm_campaign parameters
- Example:
?utm_source=google&utm_medium=cpc&utm_campaign=summer_sale
- Date range too short or wrong
- Try extending to 30 or 60 days
- Check if campaigns were active during selected period
- Domain or path filter too restrictive
- Try removing path filter (view site-wide)
- Ensure correct domain selected
- No conversions in period
- Check that you've had conversions
- Review KPI dashboard to confirm
Solution:
- Verify UTM tracking is implemented
- Extend date range
- Remove path filter temporarily
- Check conversion tracking is working
Issue: Campaign Shows Sessions But Zero Converters
Symptom: Campaign has 500+ sessions but 0 converters
Possible causes:
- Tracking issue
- Conversion tracking not working
- Campaign attribution not connecting to conversions
- Very low conversion rate
- Could be <0.2% which rounds to 0
- Genuinely no one converted
- Long sales cycle
- Sessions happened but conversions not yet
- First-touch attribution waiting for conversion
- Wrong audience
- Traffic completely misaligned with offer
- Bot traffic
Solution:
- Check conversion tracking works (test it yourself)
- Look at other campaigns – do they show converters?
- Wait a few more days (if new campaign)
- Review campaign targeting and landing page
- Check device breakdown (mobile broken?)
Issue: Numbers Don't Match Google Ads/Facebook
Symptom: Your campaign shows different numbers than platform reports
Common reasons:
- Different attribution models
- SERP360: First-touch attribution
- Google Ads: Last-click attribution (default)
- Facebook: Default attribution window differs
- Both can be "correct" with different models
- Different time zones
- Platform uses account timezone
- SERP360 uses UTC
- Can cause ±1 day differences
- Different counting methods
- SERP360: Session-level counting
- Platforms: Often event or user-level
- E.g., one session with 3 conversions = 1 in SERP360, 3 in platform
- Conversion tracking scope
- SERP360: Only path completions
- Platforms: All conversion events
- Your platform might count intermediate actions
Solution:
- Focus on trends within each platform
- Don't expect identical numbers
- Use SERP360 for cross-platform comparison
- Use platform tools for platform-specific optimisation
- Consistency within SERP360 is what matters
Issue: Extreme CVR (>50%)
Symptom: Campaign shows 80% or 90% conversion rate
Likely causes:
- Very low session count
- Example: 5 sessions, 4 converters = 80%
- Statistical noise, not reliable
- Remarketing campaign
- High-intent audience
- People who already showed interest
- 50%+ CVR can be legitimate
- Brand search
- People searching for your brand name
- Very high intent
- 40-60% CVR normal
- Email to buyers
- Existing customer promotion
- Already converted before
- High CVR expected
Solution:
- Hover over row to see actual numbers
- If <50 sessions, disregard percentage
- If legitimate (remarketing/brand), celebrate!
- If suspicious, investigate traffic source
Issue: Expanded Row Won't Open
Symptom: Click expand button but nothing happens
Solutions:
- Refresh browser
- Hard refresh: Ctrl+F5 (Windows) or Cmd+Shift+R (Mac)
- Check browser console
- F12 to open developer tools
- Look for JavaScript errors
- Share errors with support if found
- Try different browser
- Test in Chrome, Firefox, or Safari
- Rules out browser-specific issues
- Clear cache
- Clear cookies and cache
- Log out and log back in
Issue: UTM Drill-Down Shows "No Data"
Symptom: Click drill-down button but see "No data available for this breakdown"
Causes:
- Missing UTM parameter
- Campaign has utm_source but no utm_medium
- Can't break down by medium if it doesn't exist
- All sessions have same value
- All traffic from one medium (cpc)
- Nothing to compare
- Low volume
- Filtered down to very few sessions
- Not enough data for meaningful breakdown
Solution:
- Ensure full UTM tagging (source, medium, campaign, content)
- Accept that single-source campaigns won't have breakdowns
- Try broader filter (remove path filter)
Best Practices
1. Consistent UTM Naming
Why it matters: Inconsistent naming creates duplicate entries and confusion.
Good:
utm_campaign=summer_sale_2025 utm_campaign=spring_sale_2025 utm_campaign=winter_sale_2025
Bad:
utm_campaign=Summer-Sale-2025 utm_campaign=summersale2025 utm_campaign=SUMMER_SALE_25
Result of bad naming: Three separate campaigns in your table instead of one clean entry.
Best practices:
- Use lowercase
- Use underscores or hyphens consistently
- Include year for seasonal campaigns
- Be specific but concise
- Document your naming convention
Frequently Asked Questions
Q: Why does my campaign show in the table but says "(direct)"?
A: Traffic came to your site directly (typed URL, bookmark, unknown source) OR your tracking URLs are missing the utm_campaign parameter. If you expect it to be a specific campaign, check your URL tagging.
Q: What's the difference between "converters" and "conversion events"?
A:
- Converters (shown in main table): Number of sessions that converted, counted once per session
- Conversion events (not shown in main table): Total number of conversion actions, may be higher if sessions converted multiple times
If someone purchases 3 products in one visit, that's 1 converter (session) but 3 conversion events.
Q: My campaign has 1,000 sessions but only 10 are attributed to it in this table. Why?
A: This table uses first-touch attribution. Those 1,000 sessions might be the second, third, or fourth visit for those visitors. First-touch credits whichever campaign brought them initially.
To see all sessions, look at raw session counts in your web analytics tool. This tool focuses on conversion attribution.
Q: Can I see campaigns that haven't driven conversions yet?
A: No, this table only shows campaigns that have driven at least one conversion. New campaigns or awareness campaigns with zero conversions won't appear. This is intentional – it focuses on conversion performance.
Q: Why is the table hidden when I select cookieless tracking mode?
A: First-touch attribution requires cookie-based tracking to connect visitors across multiple sessions. Cookieless mode only tracks single sessions, making campaign attribution impossible.
If you need campaign performance reporting, enable cookie tracking for that domain.
Q: How far back does the attribution window go?
A: The attribution looks at the first touch within your selected date range and any conversions that happen during that range. We attribute up to 120 days.
Q: The primary channel seems wrong for my campaign. Why?
A: The system determines primary channel by looking at the most common utm_medium value across conversions for that campaign. If you're seeing unexpected results, check your UTM tagging consistency. Mixed medium values can cause confusion.