First-Click vs Last-Click Attribution
The First-Click vs Last-Click Attribution chart reveals which marketing channels are best at starting customer journeys versus which ones are best at finishing them.
What Is Attribution?
Attribution is the process of assigning credit to marketing channels for driving conversions.
The Challenge
Most customers don't convert on their first visit to your website. They typically interact with your brand multiple times through different channels before finally making a purchase:
Example Customer Journey:
- Monday: Sees your Facebook ad → Clicks → Browses product page → Leaves
- Wednesday: Searches Google for your brand → Clicks organic result → Reads reviews → Leaves
- Friday: Receives your email → Clicks link → Adds to cart → Leaves
- Saturday: Directly types your website URL → Completes purchase
The question: Which channel deserves credit for the sale?
- Facebook (started the journey)?
- Organic search (re-engaged them)?
- Email (reminded them)?
- Direct (where they finally converted)?
The answer: It depends on what you're trying to measure!
Understanding the Two Attribution Models
First-Click Attribution
What it measures: Which channels are best at attracting new customers and starting their journey with your brand.
Credit given to: The very first marketing channel that brought someone to your website.
In our example above: Facebook gets 100% credit because that's where the customer first discovered you.
Why it matters:
- Reveals your best customer acquisition channels
- Shows which channels bring in new audiences
- Helps you understand brand awareness drivers
- Guides upper-funnel marketing budget allocation
Best used for: Understanding where your customers come from initially.
Last-Click Attribution
What it measures: Which channels are best at closing sales and driving final conversions.
Credit given to: The final marketing touchpoint before conversion.
In our example above: Direct traffic gets 100% credit because that's the channel used when they finally purchased.
Why it matters:
- Reveals which channels close sales
- Shows effectiveness at the moment of decision
- Helps optimise conversion-focused campaigns
- Guides lower-funnel marketing budget allocation
Best used for: Understanding what drives people to finally convert.
What You'll See in the Chart
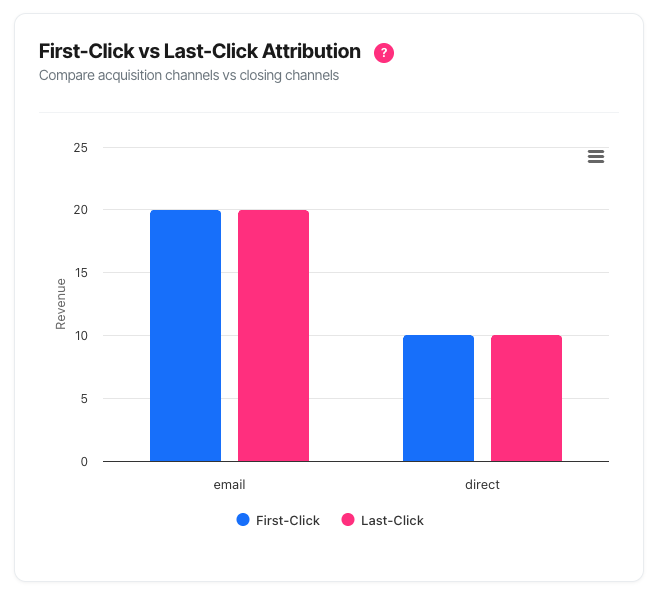
When you view your Attribution Comparison chart, you'll see:
Grouped Column Chart
- X-axis (horizontal): Your marketing channels (e.g., Paid Search, Email, Organic Search, Social)
- Y-axis (vertical): Revenue attributed to each channel
- Blue bars: First-click revenue (customer acquisition)
- Pink bars: Last-click revenue (conversion closing)
Each Channel Shows Two Bars:
- Side-by-side comparison of first-click vs last-click performance
- Easy visual comparison of acquisition vs closing effectiveness
Interactive Features:
- Hover over any bar for detailed metrics
- Export options for reports and presentations
- Insights box highlighting key findings
How to Read the Chart
Bar Heights
Taller bars = More revenue attributed
The height of each bar represents the total revenue attributed to that channel using that particular model.
Example:
- Paid Search: 6ft tall (first-click) vs 4ft tall (last-click)
- Interpretation: Paid Search brings in customers (high first-click) but they often convert through other channels later (lower last-click)
Comparing the Bars
When First-Click (Blue) Is Much Taller:
- What it means: This channel is excellent at customer acquisition
- Typical behaviour: People discover you here but convert elsewhere
- Strategic value: Essential for growth and brand awareness
- Example channels: Display advertising, social media, referrals
When Last-Click (Pink) Is Much Taller:
- What it means: This channel is excellent at closing conversions
- Typical behaviour: People may discover you elsewhere but convert here
- Strategic value: Critical for driving final purchases
- Example channels: Email, retargeting ads, branded search
When Bars Are Similar Height:
- What it means: This channel works throughout the journey
- Typical behaviour: People both discover AND convert through this channel
- Strategic value: Versatile, full-funnel performer
- Example channels: Organic search (often), direct traffic
Reading the Tooltip
When you hover over any bar, a detailed popup appears showing:
Channel Name (e.g., "Paid Search")
For Each Attribution Model (First-Click and Last-Click):
- Revenue: Total revenue attributed using this model
- Conversions: Number of converting sessions attributed
- Average Value: Revenue per conversion (Revenue ÷ Conversions)
Smart Insights (when difference is significant):
- "Strong acquisition channel" = First-click much higher
- "Strong closing channel" = Last-click much higher
Example Tooltip:
Paid Search

● First-Click
  Revenue: £45,280
  Conversions: 892
  Avg Value: £50.76

● Last-Click
  Revenue: £28,190
  Conversions: 556
  Avg Value: £50.70

Strong acquisition channel
Interpretation: Paid Search brings in lots of customers (892 first-touch conversions) but only closes 556 of them. The remaining 336 customers were closed by other channels.
Understanding Session-Level Counting
Important: Like all metrics in your dashboard, attribution uses session-level counting.
What this means:
- Each converting session is counted once per attribution model
- One session with multiple conversions = one converting session
- Aligns with your KPI dashboard for consistency
Example:
- Customer discovers via Paid Search (Monday)
- Returns and converts via Email (Friday) - buys 3 products
- First-Click Attribution: 1 converting session to Paid Search
- Last-Click Attribution: 1 converting session to Email
- Not 3 conversions (that would be event-level counting)
Why session-level:
- More accurate representation of journey success
- Prevents inflation from multi-item purchases
- Industry standard approach
- Comparable across all dashboard metrics
Practical Use Cases
1. Budget Allocation Between Channels
Scenario: You're planning next quarter's marketing budget and need to decide how much to allocate to each channel.
How to use the chart:
- Identify your acquisition channels (high first-click, lower last-click)
- Identify your closing channels (low first-click, high last-click)
- Calculate balanced budget based on both roles
Example Analysis:
| Channel | First-Click £ | Last-Click £ | Role | Budget Allocation |
|---|---|---|---|---|
| Paid Search | £45,000 | £28,000 | Acquisition leader | 30% (maintain/grow) |
| £12,000 | £38,000 | Closing leader | 20% (optimize nurture) | |
| Organic | £28,000 | £32,000 | Full-funnel | 25% (invest in SEO) |
| Social | £8,000 | £3,000 | Awareness only | 15% (test/experimental) |
| Direct | £5,000 | £18,000 | Brand strength | 10% (brand building) |
Key insight: Don't cut Paid Search budget just because last-click is lower – it's your customer acquisition engine!
2. Diagnosing Channel Performance Issues
Scenario: Your Paid Search spend is high but conversions seem low. Is it working?
How to use the chart:
- Check Paid Search first-click revenue
- Check Paid Search last-click revenue
- Compare to understand its true role
Diagnosis A: High First-Click, Low Last-Click
- Verdict: Paid Search IS working – it's bringing quality customers
- Issue: They need more nurturing to convert
- Action: Improve email sequences, retargeting, and website experience
Diagnosis B: Low First-Click, Low Last-Click
- Verdict: Paid Search is NOT working well
- Issue: Poor targeting or messaging
- Action: Review keywords, audiences, ad copy, and landing pages
Diagnosis C: Low First-Click, High Last-Click
- Verdict: Unusual pattern worth investigating
- Possible reason: Branded keywords driving last-touch conversions
- Action: Segment branded vs non-branded to understand better
3. Building Complete Marketing Funnels
Scenario: You want to create a balanced marketing strategy that covers the full customer journey.
How to use the chart:
Step 1: Identify gaps in your funnel
Look at your chart and note:
- Do you have strong acquisition channels?
- Do you have strong closing channels?
- Are any stages missing?
Example Funnel Analysis:
Top of Funnel (Awareness/Acquisition):
- ✓ Social media (high first-click)
- ✓ Display advertising (high first-click)
- ✓ Organic search (moderate first-click)
Middle of Funnel (Consideration):
- ? Email (should be here but maybe weak first-click)
- ? Retargeting (might be missing entirely)
Bottom of Funnel (Conversion):
- ✓ Email (high last-click)
- ✓ Retargeting (high last-click if present)
- ? Paid Search (should help close too)
Actions Based on Gaps:
- Missing middle funnel: Build email capture strategies
- Weak closing: Implement retargeting campaigns
- Weak acquisition: Test new awareness channels
4. Evaluating New Channel Investment
Scenario: You're considering investing in a new marketing channel and want to understand what role it might play.
How to use the chart:
- Look at similar existing channels
- Understand their attribution patterns
- Set appropriate expectations for new channel
Example: Considering TikTok Investment
Similar channel: Instagram/Facebook (Social)
- First-click: £15,000 (high)
- Last-click: £4,000 (low)
- Role: Acquisition/Awareness
Expectations for TikTok:
- Likely similar pattern (acquisition-focused)
- Don't expect immediate last-click conversions
- Budget 6-12 months for ROI via assisted conversions
- Measure success by first-click attribution initially
Wrong expectation: "TikTok should show strong last-click revenue in month 1"
Right expectation: "TikTok should bring new audiences who convert through email/retargeting over 3-6 months"
5. Justifying "Underperforming" Channels
Scenario: Your CFO wants to cut social media budget because "it doesn't drive conversions" (based on last-click only).
How to use the chart:
- Show the first-click attribution for social media
- Calculate what you'd lose by cutting it
- Explain the acquisition role
Example Defence:
Last-Click Only View:
- Social: £3,000 in revenue
- % of total: 3%
- CFO conclusion: "Not worth the spend"
Full Attribution View:
- First-click: £18,000 in revenue
- Last-click: £3,000 in revenue
- Total influence: £21,000
- % of first-touch acquisitions: 22%
Your argument:
"Social media brings 22% of our new customers (£18,000 first-click). These customers then convert through email (£8,000) and retargeting (£7,000) later. If we cut social, we lose not just £3,000 in last-click conversions, but £21,000 in total revenue. That's 7× the apparent impact."
Evidence to provide:
- Export chart showing both attributions
- Calculate customer acquisition cost for social
- Compare to other acquisition channels
- Demonstrate the need for a balanced funnel
6. Optimising Email Marketing Strategy
Scenario: Your email list is growing but you're not sure how to best use it.
How to use the chart:
- Check email's first-click attribution
- Check email's last-click attribution
- Understand its current role
- Optimise accordingly
Pattern A: High Last-Click, Low First-Click
- Current role: Conversion closer
- What's working: Your nurture sequences are effective
- Opportunity: Build list faster (more first-click potential)
- Action: Add more email capture points on website
Pattern B: High First-Click, High Last-Click
- Current role: Full-funnel powerhouse
- What's working: Both acquisition and conversion
- Opportunity: Scale this winning channel
- Action: Invest more in list growth and segmentation
Pattern C: Low Both
- Current role: Underutilised asset
- Issue: Either small list or poor engagement
- Action: Audit email strategy completely
7. Understanding Seasonal Patterns
Scenario: You want to understand how different channels perform during peak vs off-peak seasons.
How to use the chart:
- View attribution for Q4 (holiday season)
- Export the chart
- Change date range to Q1 (post-holiday)
- Export again
- Compare side-by-side
Example Seasonal Analysis:
Q4 (Holiday Season):
- Email last-click: £120,000 (very high)
- Paid Search first-click: £80,000 (high)
- Social first-click: £45,000 (moderate)
- Pattern: High awareness, high conversion
Q1 (Recovery Period):
- Email last-click: £35,000 (normal)
- Paid Search first-click: £60,000 (maintained)
- Social first-click: £18,000 (lower)
- Pattern: Acquisition continues, conversion drops
Insights:
- Email performs 3× better at closing during holidays
- Paid Search acquisition is consistent year-round
- Social responds strongly to holiday spending
- Plan email campaigns heavily in Q4
- Maintain Paid Search budget year-round
- Adjust social spend with consumer spending patterns
Troubleshooting & Common Questions
Issue: Chart Is Not Displaying
Symptoms:
- Blank space where chart should be
- Section completely hidden
- Loading spinner never resolves
Possible Causes:
1. Cookieless Mode Enabled
- Check: This feature requires cookie tracking
- Why: Attribution needs visitor journey tracking across sessions
- Solution: This is by design. Enable cookie tracking if legally permissible, or understand this feature won't be available
2. No Domain Selected
- Check: Filter bar at top of dashboard
- Why: Attribution requires domain context
- Solution: Select a specific domain from the dropdown
3. JavaScript Error
- Check: Browser console (F12)
- Why: Script may have failed to load
- Solution: Hard refresh (Ctrl+F5 / Cmd+Shift+R) or contact support
Issue: Very Low Numbers Despite Traffic
Symptoms:
- All bars very short
- Attribution numbers much lower than expected
- Doesn't match other reports
Possible Causes:
1. Recent Implementation
- Reason: Attribution models need conversion history
- Timeline: Requires at least 30 days of full tracking data
- Solution: Wait for data accumulation, check back next month
2. Identity Status Filtering
- Reason: Only conversions with identity_status='full' counted
- Explanation: Incomplete visitor tracking excluded for accuracy
- Solution: This is correct behaviour – partial data excluded for quality
3. Path Filter Applied
- Reason: You've filtered to a specific conversion path
- Explanation: Only showing that path's attributions
- Solution: Remove path filter to see all conversions
Issue: Numbers Don't Match Last-Click Reports
Symptoms:
- Your "Last-Click" attribution shows £50,000
- Another report shows £60,000 for the same channels
- Confused about discrepancy
Possible Causes:
1. Different Counting Methods
- This chart: Session-level counting
- Other report: May use event-level or visitor-level
- Impact: 10-30% variance is normal
- Solution: Focus on trends, not absolute matches
2. Different Attribution Windows
- This chart: Based on conversion date range
- Other report: May use longer lookback window
- Impact: Earlier touchpoints may be included/excluded differently
- Solution: Ensure same date ranges for comparison
3. Different Currency
- This chart: Uses conversion currency as recorded
- Other report: May convert all to single currency
- Impact: Multi-currency situations cause differences
- Solution: Filter to single currency for comparison
Issue: Some Channels Missing
Symptoms:
- You know you run Facebook ads but "Social" isn't showing
- Expected channels absent from chart
- Only 2-3 channels appearing
Possible Causes:
1. No Conversions Attributed
- Reason: That channel touched visitors but didn't get credit in selected period
- Explanation: Could be awareness-only, or conversions happened outside date range
- Solution: Extend date range or check if any conversions occurred
2. Channel Classification Issues
- Reason: UTM parameters not set correctly
- Explanation: Traffic may be classified as "(unknown)" or wrong channel
- Solution: Audit UTM parameter implementation on campaigns
3. Very Recent Campaigns
- Reason: New campaigns take time to show results
- Explanation: Particularly true for first-click (acquisition takes time)
- Solution: Wait 2-4 weeks for meaningful data
Issue: Extreme Differences Between Models
Symptoms:
- One channel shows £100,000 first-click but £500 last-click
- Seems unrealistic
- Questioning data accuracy
This is actually NORMAL and informative:
Example: Display Advertising
- First-click: £100,000
- Last-click: £500
- Ratio: 200:1
Why this happens:
- Display ads introduce many people to your brand
- Those people then convert through other channels (email, search, etc.)
- Display did its job (acquisition) but doesn't close sales
- This is the exact insight attribution provides!
What it tells you:
- Display is WORKING as an acquisition channel
- You NEED other channels to close these prospects
- Cutting display would hurt £100k of initiated journeys
- This is valuable, actionable insight
Action: Don't panic – use this information strategically
Issue: Direct Traffic Dominating Last-Click
Symptoms:
- Direct traffic shows huge last-click attribution
- Seems to be "stealing" credit from other channels
- Suspiciously high
This is common and has multiple explanations:
Legitimate Reasons:
- Strong Brand: People remember your URL and return directly
- Saved Bookmarks: Visitors bookmarked and return via bookmark
- Offline Marketing: Business cards, TV, radio driving direct visits
- Email Apps: Some email clients strip referrer data, shows as direct
What to do:
- Good direct traffic: Sign of brand strength, celebrate it
- Check branded search: Compare to branded search first-click
- Review email: Are email last-clicks lower than expected?
- Context matters: Evaluate against industry norms
When it's a problem:
- ALL last-click is direct (tracking issue)
- Direct grew 10× suddenly (attribution error)
- No first-click for any channel (tracking broken)
Solution if problematic: Audit tracking implementation, especially UTM parameters and referrer passing
Frequently Asked Questions
Q: Why does my Direct traffic have such high last-click attribution?
A: This is actually common and usually positive. It means:
- Brand strength: People remember and return to your site directly
- Repeat customers: Returning buyers often use direct navigation
- Offline influence: Marketing outside digital drives direct visits
- Email clicks: Some email clients don't pass referrer data properly
What to do: Celebrate strong direct traffic as brand equity, but audit if it seems suspiciously high (>60% of total).
Q: Should I only focus on channels with high last-click attribution?
A: No! This is the #1 mistake. Last-click attribution alone ignores customer acquisition. Channels with high first-click but low last-click are often essential for growth – they bring new customers who convert through other channels later.
Remember: You need BOTH acquisition channels (first-click) and conversion channels (last-click) for a healthy marketing ecosystem.
Q: How long before a new channel shows up in attribution?
A:
- First-click: Should appear within 2-4 weeks
- Last-click: May take 1-3 months as people progress through journey
- Meaningful patterns: Typically 2-3 months of data needed
Q: Why do the revenue numbers differ from my KPI dashboard?
A: Small differences (5-15%) are normal due to:
- Attribution models exclude some partial-identity conversions for accuracy
- KPIs show all conversions, attribution shows only those with complete journey data
- Currency handling may differ slightly
Focus on trends rather than exact number matches.
Q: What if I only have one marketing channel?
A: The chart will show just that one channel with identical first and last-click attribution. This indicates:
- Very simple customer journey (good for high-intent products)
- OR you're not tracking other channels properly
- OR you're missing diversification opportunities
Consider: Adding channels for resilience and growth.
Q: Does this work for B2B with long sales cycles?
A: Yes, but with longer timeline expectations:
- First-click may happen 6-12 months before conversion
- Multiple touches in between (not shown in this first/last view)
- Email and Direct typically dominate last-click
- Content/Organic typically dominate first-click
Tip: Use longer date ranges (90-120 days) for B2B analysis.