Channel Performance Table
The Channel Performance table is your command centre for understanding which marketing channels are delivering results. It shows how different traffic sources—from paid search to organic social—contribute to your conversions, allowing you to make data-driven decisions about where to invest your marketing budget.
What You'll See
The Channel Performance table displays a comprehensive breakdown of every marketing channel driving traffic to your website, with each row showing:
Core Metrics (Always Visible):
- Channel name (e.g., "Paid Search", "Organic Search", "Email")
- Sessions entering via this channel
- Converting sessions from this channel
- Revenue attributed to this channel
- Session conversion rate and revenue per visit
Additional Journey Metrics (Cookie Tracking Mode):
- Average days from first touch to conversion
- Average sessions required to convert
- Average touchpoints in the customer journey
- Percentage of new customers
Interactive Features:
- Attribution model toggle (First-Click vs Last-Click)
- Expandable rows revealing device and referrer breakdowns
- CSV export for deeper analysis
- Real-time updates based on your filter selections
The table automatically adapts to your selected filters (domain, path, date range, campaign) and updates instantly when you make changes.
Understanding Marketing Channels
What Is a Channel?
A channel represents the source or medium through which visitors arrive at your website. It's how they found you. SERP360 automatically categorises traffic into standard marketing channels based on:
- Referrer information (where they came from)
- UTM parameters (your campaign tracking codes)
- URL patterns (recognised traffic sources)
The Standard Channels
Paid Search
- What it is: Visitors from paid search ads (Google Ads, Bing Ads, etc.)
- Identified by: UTM medium of 'cpc', 'ppc', or 'paidsearch'
- Examples: Google Ads campaigns, Bing search ads
- Typical behaviour: High intent, ready to act, but can be expensive
Organic Search
- What it is: Visitors from unpaid search engine results
- Identified by: Referrers from Google, Bing, Yahoo, DuckDuckGo, etc. without paid parameters
- Examples: Someone finding you via Google search
- Typical behaviour: High intent, lower cost, but requires SEO investment
Social
- What it is: Organic social media traffic
- Identified by: UTM medium of 'social' or referrers from social platforms
- Examples: Facebook, Twitter, Instagram, LinkedIn (unpaid posts)
- Typical behaviour: Discovery-focused, may require longer nurturing
Paid Social
- What it is: Paid social media advertising
- Identified by: UTM medium of 'paid_social', 'paidsocial', or 'cpm'
- Examples: Facebook Ads, Instagram Ads, LinkedIn Ads
- Typical behaviour: Targeted reach, variable intent depending on campaign type
- What it is: Traffic from email campaigns
- Identified by: UTM medium of 'email'
- Examples: Newsletter clicks, promotional emails, triggered campaigns
- Typical behaviour: Known audience, typically high engagement
Referral
- What it is: Traffic from other websites linking to you
- Identified by: Referrer from external sites not matching other channels
- Examples: Blog mentions, partner sites, directory listings
- Typical behaviour: Varies widely depending on referrer quality
Direct
- What it is: Visitors typing your URL directly or using bookmarks
- Identified by: No referrer information and no UTM parameters
- Examples: Typing "yoursite.com" into browser, bookmarks, mobile apps
- Typical behaviour: Brand aware, often returning customers
Display
- What it is: Banner advertising and display networks
- Identified by: UTM medium of 'display' or 'banner'
- Examples: Google Display Network, programmatic ads
- Typical behaviour: Awareness-focused, may require remarketing
Affiliate
- What it is: Traffic from affiliate partners
- Identified by: UTM medium of 'affiliate'
- Examples: Commission-based partner sites
- Typical behaviour: Performance-driven, pre-qualified traffic
(
Unknown)
- What it is: Traffic that couldn't be categorised
- Why it happens: Missing referrer data, privacy settings, technical issues
- Action needed: Review tracking implementation if this is significant
Attribution Models Explained
What Is Attribution?
Attribution is about giving credit to marketing channels for driving conversions. The challenge is that customers typically interact with multiple channels before converting—they might see a Facebook ad, then search for you on Google, then return directly to purchase. Which channel deserves credit for the sale?
That's where attribution models come in.
First-Click Attribution
Definition: Gives 100% credit to the first channel a customer interacted with.
Philosophy: "What brought them in the door?"
How it works:
- Sarah sees your Facebook ad (First touch: Social)
- Next week, she searches and clicks your Google Ad (Second touch: Paid Search)
- She returns directly and purchases (Third touch: Direct)
- Result: Social gets full credit
Best for:
- Understanding awareness and discovery
- Measuring top-of-funnel performance
- Evaluating new customer acquisition channels
- Assessing brand-building campaigns
Example insights:
- "Paid Social brings in customers, but they take time to convert"
- "Email is our best acquisition channel"
- "Our content marketing (Organic Search) drives quality leads"
Last-Click Attribution
Definition: Gives 100% credit to the last channel a customer interacted with before converting.
Philosophy: "What closed the deal?"
How it works:
- Sarah sees your Facebook ad (First touch: Social)
- Next week, she searches and clicks your Google Ad (Second touch: Paid Search)
- She returns directly and purchases (Third touch: Direct)
- Result: Direct gets full credit
Best for:
- Understanding conversion triggers
- Measuring bottom-of-funnel performance
- Evaluating closing effectiveness
- Assessing remarketing campaign success
Example insights:
- "Email drives final conversions for users already considering us"
- "Direct traffic indicates strong brand recognition at purchase time"
- "Paid Search captures high-intent, ready-to-buy customers"
Which Model Should You Use?
Use First-Click when:
- You're focused on customer acquisition
- You want to justify top-of-funnel spending
- You're measuring brand awareness campaigns
- You need to understand initial discovery channels
Use Last-Click when:
- You're focused on conversion optimization
- You want to justify bottom-of-funnel spending
- You're measuring closing effectiveness
- You need to understand conversion triggers
Best practice: Use both!
- First-Click shows which channels find customers
- Last-Click shows which channels convert customers
- Comparing both reveals your full funnel story
Example comparison:
| Channel | First-Click Revenue | Last-Click Revenue | Insight |
|---|---|---|---|
| Paid Social | £50,000 | £15,000 | Great at discovery, weak at closing |
| £20,000 | £45,000 | Weak at acquisition, excellent at closing | |
| Paid Search | £30,000 | £40,000 | Balanced—good at both |
Interpretation:
- Paid Social is your acquisition engine—keep investing
- Email is your closing engine—nurture your list
- Paid Search works throughout the journey—maintain spend
Understanding the Metrics
Sessions
What it shows: The total number of website visits that entered via this channel during your selected time period.
Counting method: Session-level. Each visit is counted once.
Why it matters: This is your volume metric. It tells you how much traffic each channel drives.
Example:
- Paid Search: 5,247 sessions
- Organic Search: 3,891 sessions
- Email: 1,204 sessions
Interpretation:
- Paid Search drives the most traffic (highest volume)
- This is your reach by channel
- Higher isn't always better—quality matters too
Key questions to ask:
- Which channels drive the most traffic?
- Is traffic volume declining or growing?
- Do high-volume channels also convert well?
- Am I investing proportionally to volume?
Converting Sessions
What it shows: The number of sessions that resulted in at least one path completion.
Counting method: Session-level. Each converting session is counted once, even if it had multiple conversions.
Why it matters: This is your quality metric. It tells you which channels drive valuable traffic that actually converts.
Important: This is attributed based on your selected model:
- First-Click: Sessions where this channel was the first touch
- Last-Click: Sessions where this channel was the last touch before conversion
Example:
- Paid Search: 421 converting sessions (from 5,247 sessions)
- Organic Search: 325 converting sessions (from 3,891 sessions)
- Email: 189 converting sessions (from 1,204 sessions)
Interpretation:
- Email has the highest conversion rate (15.7%)
- Organic Search is second (8.4%)
- Paid Search has the lowest rate (8.0%) but highest volume
Key questions to ask:
- Which channels drive the most conversions?
- How does volume compare to conversion quality?
- Are high-converting channels getting enough traffic?
- Should I shift budget toward higher-quality channels?
Revenue
What it shows: The total monetary value of conversions attributed to this channel.
Attribution: Follows your selected model (First-Click or Last-Click).
Currency: Automatically displayed in your configured currency (£, $, €, etc.).
Why it matters: This is your value metric. It shows which channels drive actual business results.
Example:
- Paid Search: £42,150 (421 conversions @ £100 avg)
- Organic Search: £39,000 (325 conversions @ £120 avg)
- Email: £28,350 (189 conversions @ £150 avg)
Interpretation:
- Paid Search drives the most revenue (volume × average order)
- Email has the highest average order value
- Total attributed revenue varies by model choice
Key questions to ask:
- Which channel drives the most revenue?
- How does revenue align with investment?
- Are high-revenue channels profitable?
- What's the ROI by channel?
Average Days (Journey Length)
What it shows: The average number of days from first touch to conversion for sessions attributed to this channel.
Available in: Cookie tracking mode only (requires cross-session tracking).
Counting: Per converting session—how long did it take from their first interaction to conversion?
Why it matters: Reveals the sales cycle length for each channel. Some channels drive quick conversions, others require nurturing.
Example:
- Email: 2.3 days (fast conversion)
- Paid Search: 5.7 days (moderate consideration)
- Organic Search: 14.2 days (long research period)
Interpretation:
- Email works with warm audiences (existing subscribers)
- Paid Search captures mid-funnel intent
- Organic Search attracts early-stage researchers
Key questions to ask:
- Which channels drive quick conversions?
- Which require long nurturing periods?
- How should this affect my remarketing strategy?
- Am I supporting long-cycle channels with appropriate follow-up?
Sessions to Convert (Average Sessions)
What it shows: The average number of sessions required before a customer converted, for conversions attributed to this channel.
Available in: Cookie tracking mode only (requires visitor tracking).
Counting: Per path completion—how many times did visitors return before converting?
Why it matters: Shows engagement intensity required by channel. Some channels convert immediately, others need multiple visits.
Example:
- Direct: 1.2 sessions (immediate purchases)
- Email: 1.8 sessions (quick decision after email)
- Organic Search: 3.4 sessions (multiple research visits)
Interpretation:
- Direct traffic is ready to buy (probably returning customers)
- Email drives action within a few visits
- Organic Search requires more touchpoints to convert
Key questions to ask:
- Which channels convert on first visit?
- Which require multiple sessions?
- Am I providing enough information for multi-session channels?
- Should I adjust messaging based on typical session count?
Touchpoints (Average Touchpoints)
What it shows: The average number of distinct interactions a customer had before converting, for conversions attributed to this channel.
Available in: Cookie tracking mode only (requires journey tracking).
Counting: Per converting session—how many different touchpoints occurred in their journey?
Why it matters: Reveals the complexity of customer journeys for each channel. More touchpoints mean more interactions before purchase.
Important distinction:
- Sessions: Number of visits (can be same channel repeatedly)
- Touchpoints: Number of distinct interactions (often across multiple channels)
Example:
- Direct: 2.1 touchpoints (simple journey)
- Paid Search: 4.3 touchpoints (moderate complexity)
- Organic Search: 7.8 touchpoints (complex research journey)
Interpretation:
- Direct traffic has simple paths (brand aware, ready to buy)
- Paid Search captures mid-journey customers (some research done)
- Organic Search starts complex journeys (extensive comparison)
Key questions to ask:
- Which channels initiate simple vs. complex journeys?
- Are high-touchpoint channels getting sufficient support?
- Should I adjust attribution thinking based on journey complexity?
- How does this align with my sales cycle expectations?
Multi-touchpoint reality:
Imagine a customer's journey with 7.8 touchpoints:
- Sees Facebook ad (Social)
- Searches on Google, clicks organic result (Organic Search)
- Leaves, returns via Google Ad (Paid Search)
- Receives email, clicks through (Email)
- Returns directly to compare (Direct)
- Clicks email again (Email)
- Searches brand name, clicks ad (Paid Search)
- Returns directly and purchases (Direct)
With First-Click attribution: Social gets credit With Last-Click attribution: Direct gets credit Reality: All 8 touchpoints contributed to the conversion
This is why:
- Simple attribution models aren't perfect
- Multiple channels work together
- Cutting any channel might impact others
- Balanced channel investment usually works best
Session CR (Session Conversion Rate)
What it shows: The percentage of sessions from this channel that resulted in a conversion.
Formula: (Converting Sessions ÷ Sessions) × 100
Why it matters: This is your efficiency metric. It shows which channels drive the highest quality traffic.
Example:
- Email: 15.7% (189 converting / 1,204 sessions)
- Organic Search: 8.4% (325 converting / 3,891 sessions)
- Paid Search: 8.0% (421 converting / 5,247 sessions)
Interpretation:
- Email has the highest conversion rate (engaged audience)
- Organic and Paid Search are similar (good intent)
- Higher is better, but context matters
Important note: This is NOT visitor-level CVR
The Session CR shown here is session-level, meaning:
- Counts: Converting sessions ÷ Total sessions
- NOT the visitor-level CVR defined in your analytics principles
- Visitor-level CVR would be: Unique converters ÷ Unique visitors
Why session-level?
- Standard for channel attribution analysis
- More actionable for marketing optimization
- Easier to calculate at scale
- Industry standard for campaign performance
Benchmarks by channel:
| Channel Type | Typical Session CR |
|---|---|
| 10-20% (warm audience) | |
| Direct | 8-15% (brand aware) |
| Organic Search | 5-10% (high intent) |
| Paid Search | 3-8% (varies by targeting) |
| Social | 2-5% (discovery-focused) |
| Referral | 1-5% (varies by source) |
| Display | 0.5-2% (awareness) |
Remember: Your baseline matters more than industry averages!
Key questions to ask:
- Which channels have the highest conversion rates?
- Are low-converting channels worth the investment?
- Can I improve conversion rates through better landing pages?
- Should I reallocate budget to high-efficiency channels?
RPV (Revenue Per Visit)
What it shows: The average revenue generated per session for this channel.
Formula: Revenue ÷ Sessions
Why it matters: This combines volume and value. It's your bottom-line efficiency metric—how much is each visit worth?
Example:
- Email: £23.54 (£28,350 ÷ 1,204 sessions)
- Organic Search: £10.02 (£39,000 ÷ 3,891 sessions)
- Paid Search: £8.03 (£42,150 ÷ 5,247 sessions)
Interpretation:
- Email generates the most value per visit
- Each email click is worth nearly 3× a paid search click
- Email subscribers are highly valuable
Why RPV matters more than conversion rate:
Scenario A:
- Channel X: 10% conversion rate, £5 average order = £0.50 RPV
- Channel Y: 5% conversion rate, £20 average order = £1.00 RPV
Better channel: Y (despite lower conversion rate!)
The formula reveals all:
RPV = Conversion Rate × Average Order Value
High RPV can come from:
- High conversion rate (more conversions)
- High average order value (bigger purchases)
- Both!
Key questions to ask:
- Which channels deliver the highest RPV?
- How does RPV compare to customer acquisition cost?
- Are high-RPV channels getting enough investment?
- Can I improve RPV through bundling or upselling?
New Customer %
What it shows: The percentage of conversions from this channel that came from first-time customers.
Available in: Cookie tracking mode only (requires customer history tracking).
Formula: (First-time conversions ÷ Total conversions from channel) × 100
Why it matters: Shows whether a channel acquires new customers or re-engages existing ones.
Example:
- Paid Social: 87% (acquisition-focused)
- Organic Search: 73% (mixed)
- Email: 34% (retention-focused)
Interpretation:
- Paid Social is your primary acquisition channel
- Organic Search balances new and returning
- Email primarily re-engages existing customers
Key questions to ask:
- Which channels acquire new customers?
- Which channels retain existing customers?
- Am I investing appropriately in acquisition vs. retention?
- Do my new customer percentages align with business goals?
Using the Attribution Model Toggle
Switching Between Models
Location: Top-right corner of the Channel Performance section
Options:
- First-Click (default)
- Last-Click
How to switch:
- Click the button for your desired model
- The table instantly updates
- The suffix "(First-Click)" or "(Last-Click)" updates in the header
- All metrics recalculate based on the new model
What changes:
- Converting sessions attribution
- Revenue attribution
- All derived metrics (Session CR, RPV)
- Journey metrics (recalculated for the attributed conversions)
What stays the same:
- Total sessions (this doesn't change with attribution)
- The channels listed (same channels appear)
- Filters applied (date range, domain, path, etc.)
Comparing Models: A Practical Example
Let's walk through a real scenario to see why both models matter.
Your Current View (First-Click):
| Channel | Sessions | Converting Sessions | Revenue | Session CR |
|---|---|---|---|---|
| Paid Social | 2,500 | 200 | £40,000 | 8.0% |
| 1,000 | 50 | £15,000 | 5.0% | |
| Direct | 3,000 | 100 | £25,000 | 3.3% |
Interpretation: "Paid Social is our best acquisition channel!"
Now Switch to Last-Click:
| Channel | Sessions | Converting Sessions | Revenue | Session CR |
|---|---|---|---|---|
| Paid Social | 2,500 | 75 | £15,000 | 3.0% |
| 1,000 | 150 | £30,000 | 15.0% | |
| Direct | 3,000 | 225 | £45,000 | 7.5% |
Interpretation: "Email is our best closing channel!"
The Complete Story:
Paid Social's role:
- Discovers customers (high first-click)
- Doesn't close them (low last-click)
- Strategy: This is your awareness engine. Keep spending here, but pair with remarketing.
Email's role:
- Doesn't discover customers (low first-click)
- Excellent at closing (high last-click)
- Strategy: This is your closing engine. Grow your email list to scale conversions.
Direct's role:
- Moderate at both discovery and closing
- Consistent across models
- Strategy: Strong brand recognition. These people know who you are.
Key insight: Without comparing both models, you'd miss that Paid Social and Email work together. Cutting Paid Social would hurt Email's performance!
Common Attribution Scenarios
Scenario 1: First-Click > Last-Click
Example:
- Organic Search: £50k first-click, £20k last-click
What it means:
- This channel initiates customer journeys
- Customers discover you here but convert elsewhere
- Long consideration period
Scenario 2: Last-Click > First-Click
Example:
- Email: £15k first-click, £45k last-click
What it means:
- This channel closes deals
- Customers arrive via other channels first
- Effective at driving action
Scenario 3: First-Click ≈ Last-Click
Example:
- Paid Search: £35k first-click, £38k last-click
What it means:
- Balanced performance throughout funnel
- Works at both discovery and closing
- Versatile channel
Scenario 4: Both Models Show High Performance
Example:
- Direct: £60k first-click, £65k last-click
What it means:
- Strong brand recognition
- Customers seeking you out specifically
- Likely includes returning customers
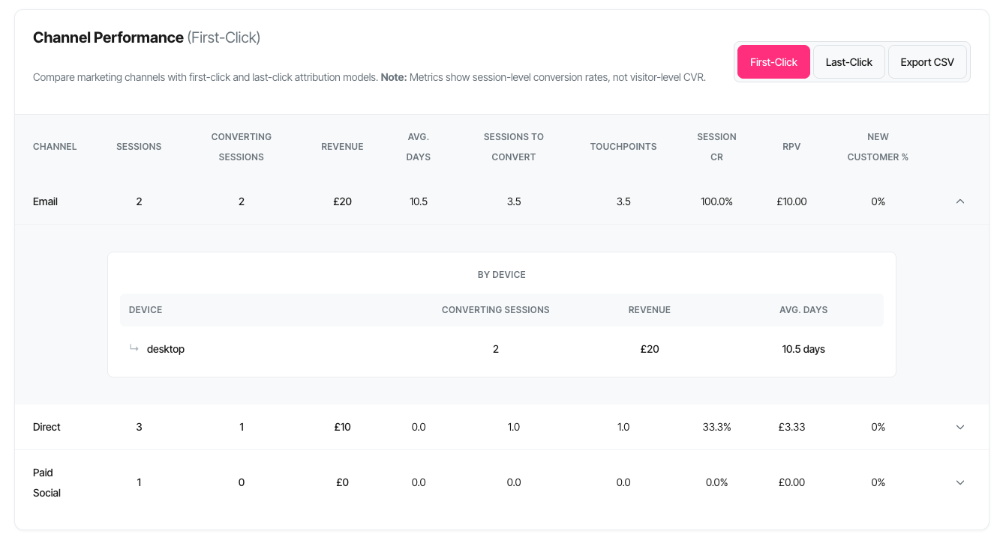
Expandable Row Breakdowns
How to Expand Rows
Action: Click the down arrow (▼) button on the right side of any channel row.
What happens:
- The row expands to reveal additional detail
- Two breakdown sections appear: "By Device" and (for Referral) "Top Referrers"
- The arrow rotates to point up (▲)
To collapse: Click the arrow again.
Visual indicator: Expanded rows have a subtle highlight and the arrow points up.
Device Breakdown
What it shows: How this channel performs across different device types.
Available for: All channels
Metrics displayed:
Cookie Tracking Mode:
- Device type (Desktop, Mobile, Tablet)
- Converting Sessions (sessions that converted from this device)
- Revenue (attributed revenue from this device)
- Avg. Days (average journey length from this device)
Cookieless Mode:
- Device type
- Converting Sessions
- Revenue
Why it matters: Different devices have different user behaviour and conversion rates.
Example breakdown for Paid Search:
| Device | Converting Sessions | Revenue | Avg. Days |
|---|---|---|---|
| Desktop | 245 | £32,150 | 4.2 |
| Mobile | 156 | £8,750 | 6.8 |
| Tablet | 20 | £1,250 | 5.1 |
Insights:
- Desktop drives most conversions and revenue
- Mobile has longer consideration period
- Mobile users may be researching, then converting on desktop
- Consider mobile-specific optimisations
Referrer Breakdown
What it shows: For Referral channel only, shows which specific websites are sending you traffic.
Available for: Referral channel only
Metrics displayed:
- Referrer domain (e.g., "facebook.com", "blog.example.com")
- Converting Sessions (sessions from this referrer that converted)
- Revenue (attributed revenue from this referrer)
Sorted by: Converting sessions (highest first)
Limit: Top 10 referrers shown
Why it matters: Not all referrers are equal. Some websites send high-quality traffic, others don't.
Example breakdown for Referral:
| Referrer | Converting Sessions | Revenue |
|---|---|---|
| industry-blog.com | 45 | £8,750 |
| partner-site.co.uk | 28 | £5,250 |
| news-outlet.com | 12 | £3,150 |
| forum.example.com | 8 | £980 |
| directory.example.org | 3 | £420 |
Insights:
- Industry blog drives highest quality traffic
- Partner site is valuable relationship
- News outlet coverage generated conversions
- Forum mentions have lower conversion rate
- Directory listing has minimal impact
Cookieless Mode vs Cookie Tracking
Understanding the Two Modes
Your Channel Performance table adapts based on your domain's tracking configuration. The mode affects what metrics you see and how data is calculated.
Cookie Tracking Mode (Full Attribution)
When active:
- Full visitor tracking across sessions
- Complete customer journey data
What you see:
Columns:
- Channel
- Sessions
- Converting Sessions
- Revenue
- Avg. Days
- Sessions to Convert
- Touchpoints
- Session CR
- RPV
- New Customer %
- Expand button
Capabilities:
- First-Click vs Last-Click attribution
- Cross-session journey metrics
- New vs returning customer tracking
- Multi-touch attribution insights
Cookieless Mode (Aggregate Data)
When active:
- Privacy-focused tracking
- Single-session scope only
What you see:
Columns:
- Channel
- Sessions
- Converting Sessions
- Revenue
- Session CR
- RPV
- Expand button
Capabilities:
- Privacy-compliant tracking
- Fast performance
- Session-level metrics
- Device breakdowns
Limitations:
- No cross-session journey data
- No Avg. Days to Convert
- No Sessions to Convert
- No Touchpoints
- No New Customer %
- First-Click and Last-Click models hidden (both same in single-session)
Exporting and Sharing Data
CSV Export Function
How to export:
- Click the "Export CSV" button in the top-right corner of the Channel Performance section
- Your browser automatically downloads a CSV file named "channel-performance-[date].csv"
- Open in Excel, Google Sheets, or any spreadsheet application
What's included in the export:
Cookie Tracking Mode:
- Channel Name
- Sessions
- Converting Sessions
- Revenue
- Avg. Days
- Avg. Sessions
- Touchpoints
- Session Conv. Rate (%)
- RPV
- New Customer (%)
Cookieless Mode:
- Channel Name
- Sessions
- Converting Sessions
- Revenue
- Session Conv. Rate (%)
- RPV
Export reflects:
- Your current attribution model selection (First-Click or Last-Click)
- Your active filters (domain, path, date range, campaign)
- The current date range
The export does NOT include:
- Device breakdowns (these are only in the expandable rows)
- Referrer breakdowns (these are only in the expandable rows)
Troubleshooting Common Issues
Issue: No Data Showing in Table
Symptom: Table shows "No data available for selected filters"
Possible causes:
1. No domain selected:
- Solution: Select a domain from the domain filter at the top of the dashboard
2. Date range has no activity:
- Solution: Try extending the date range to 30 or 60 days
- Check if your tracking was active during the selected period
3. Path filter too restrictive:
- Solution: Remove the path filter or select "All Paths"
- Some paths may have limited traffic
4. Campaign filter eliminating all data:
- Solution: Select "All Campaigns" to see if data appears
- Check campaign name spelling
5. Tracking not yet implemented:
- Solution: Verify tracking code is installed
- Check that conversions are being recorded
Issue: Metrics Seem Too Low
Symptom: All conversion rates are under 1%, RPV is very low
Possible causes:
1. Wrong traffic mix:
- Check if you're seeing mostly awareness traffic (Display, Social)
- These channels naturally have lower conversion rates
2. Tracking issues:
- Conversions may not be properly attributed
- Check if conversions are showing in Conversion KPIs
3. Long sales cycle:
- Your product may require longer consideration
- Check Avg. Days to Convert metric
- May need to extend date range
4. First visit to new tracking:
- Initial data may take time to accumulate
- Give it 2-4 weeks to stabilise
5. Cookieless mode:
- Limited attribution may reduce apparent conversions
- This is expected behaviour
Issue: Attribution Models Show Identical Results
Symptom: First-Click and Last-Click numbers are exactly the same
Possible causes:
1. Cookieless mode:
- Single-session tracking can't differentiate models
- Models effectively collapse to same attribution
- This is expected—switch to cookie tracking for model differences
2. Single-touch journeys:
- If all conversions happen in single session
- No difference between first and last touch
- Check Avg. Sessions to Convert (should be > 1)
3. Short time period:
- Very short date ranges may not show differences
- Try extending to 30-60 days
Issue: Channel Mix Doesn't Match Google Analytics
Symptom: Your channels show different numbers than Google Analytics
Common reasons:
1. Different channel definitions:
- SERP360 uses specific logic for channel classification
- Google Analytics may categorise differently
- Both can be "correct" with different rules
2. Different attribution models:
- GA often defaults to Last Non-Direct Click
- SERP360 offers First-Click and Last-Click
- These will give different results
3. Different date ranges:
- Verify you're comparing same time periods
- Check if time zones differ
4. Different scopes:
- GA may show site-wide data
- SERP360 may be filtered to specific path
5. Conversion definition differences:
- Ensure you're comparing same conversion goals
- GA goals may not match SERP360 paths exactly
Resolution:
- Don't expect perfect matches
Issue: New Customer % is 0% or 100%
Symptom: All channels show either 0% or 100% new customers
Possible causes:
1. Insufficient historical data:
- Recently implemented tracking
- All conversions appear "new" (100%)
- Give it time to build customer history
2. Cookieless mode:
- Can't track customer history
- Metric may not display or be unreliable
3. All conversions from one user:
- Test data or very low volume
- One person converting multiple times (0%)
- Or all different people (100%)
4. Filter eliminating context:
- Very narrow date range or path
- Expand filters to see more representative data
Issue: Huge Difference Between First-Click and Last-Click
Symptom: A channel shows £50k first-click but only £5k last-click (or vice versa)
This is actually normal! It reveals important insights about channel roles.
Large first-click, small last-click:
- Channel is discovery-focused
- Customers find you here but convert elsewhere
- Don't cut this channel—it's your acquisition engine
Small first-click, large last-click:
- Channel is closing-focused
- Customers arrive via other channels first
- Don't cut this channel—it's your conversion engine
What to do:
- Embrace the difference—it's informative!
- Use both attributions in budget planning
- Understand channels work together