Days to Conversions Chart
The Days to Conversion Distribution chart reveals how long it takes your customers to convert after their first interaction with your marketing. Instead of just knowing the average journey length, this visualisation shows you the complete distribution – how many convert quickly, how many take weeks, and which devices show different behaviour patterns.
What You'll See
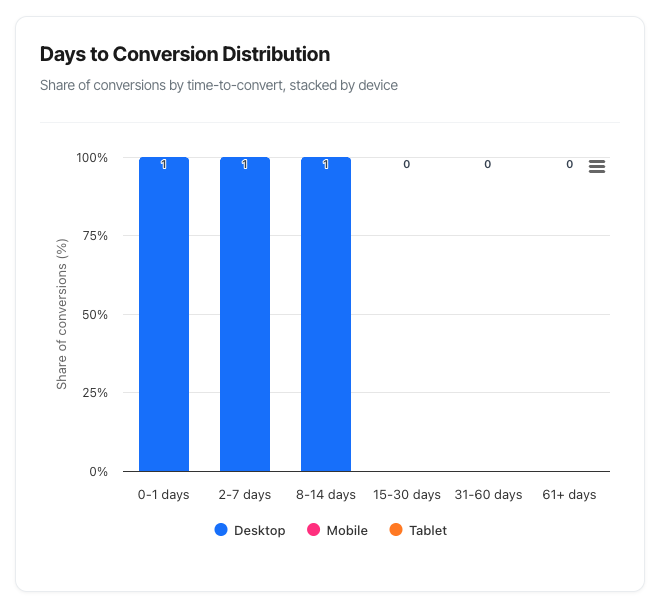
The Days to Conversion Distribution is a stacked column chart displaying:
- Six time buckets along the bottom (0-1 days, 2-7 days, etc.)
- Coloured segments showing device types (Desktop in blue, Mobile in green, Tablet in orange)
- Percentage heights representing the share of conversions in each timeframe
- Interactive tooltips revealing exact session counts and percentages
- A legend identifying which colour represents which device
The chart updates automatically when you change your filters, allowing you to see how journey duration varies across different campaigns, paths, or time periods.
Understanding the Chart
The Vertical Axis (Y-Axis)
What it shows: Percentage of total conversions (0% to 100%)
How it works: Each column represents 100% of your conversions. The coloured segments stack to show what proportion converted on which device.
Reading the scale:
- 0% = No conversions
- 50% = Half of all conversions
- 100% = All conversions
Important: This is a percentage distribution, not raw counts. A taller segment means a larger share of conversions, not necessarily more conversions.
The Horizontal Axis (X-Axis)
What it shows: Time buckets measuring days from first marketing touch to conversion
The six buckets explained:
0-1 Days (Immediate Converters)
What it represents:
- Conversions within 24 hours of first marketing touch
- Very short consideration period
- Fast decision-making
Typical scenarios:
- Impulse purchases
- Strong immediate intent
- Simple, low-commitment products
- Urgent needs (e.g., next-day delivery items)
- Very targeted, high-intent campaigns
Example: Customer clicks a paid search ad for "buy iPhone 15" and purchases within the hour.
2-7 Days (Quick Converters)
What it represents:
- Conversions within one week of first touch
- Short but deliberate consideration
- Some comparison shopping
Typical scenarios:
- Standard e-commerce purchases
- Moderate-priced items (£50-200)
- Products with good reviews and clear value
- Email nurture working quickly
- Effective remarketing
Example: Customer discovers your brand via social media on Monday, receives a welcome email series, and purchases on Friday.
8-14 Days (Considered Converters)
What it represents:
- Conversions within two weeks
- Moderate consideration period
- Multiple touchpoints likely
- Research and comparison phase
Typical scenarios:
- Higher-value items (£200-500)
- Products requiring more research
- Services needing trust-building
- Payday timing effects
- Multi-touchpoint nurture sequences
Example: Customer sees a display ad, researches via organic search over a weekend, reads reviews, and purchases the following week.
15-30 Days (Standard Nurture)
What it represents:
- Conversions within a month
- Extended consideration
- Multiple touchpoints essential
- Significant research phase
Typical scenarios:
- High-value purchases (£500+)
- Complex products or services
- B2B initial purchases
- Subscription commitments
- Major household purchases
Example: Customer enters via organic search, joins email list, receives multiple nurture emails, clicks remarketing ads, and purchases 3 weeks later.
31-60 Days (Extended Nurture)
What it represents:
- Conversions within two months
- Long consideration period
- Many touchpoints required
- Substantial commitment
Typical scenarios:
- Very expensive items (£1,000+)
- Complex B2B solutions
- Professional services
- Major life purchases (holidays, renovations)
- Luxury goods
Example: Business owner researches software solutions over 6 weeks, attends a webinar, has demo calls, and purchases after thorough evaluation.
61+ Days (Very Long Nurture)
What it represents:
- Conversions taking more than two months
- Very long sales cycles
- Extensive evaluation periods
- Maximum commitment level
Typical scenarios:
- Enterprise software
- Major B2B contracts
- Extremely high-value items (£5,000+)
- Services requiring board approval
- Real estate, vehicles, education
Example: Enterprise customer evaluates your SaaS product over 4 months, involving multiple stakeholders, ROI analysis, and security reviews before signing.
The Coloured Segments (Device Types)
Each column is divided into coloured segments representing device types:
Desktop (Blue)
- Computers and laptops
- Typically shows:
- Longer sessions
- Higher average order values
- More research behaviour
- Complex purchases
- Business/work-hours conversions
Mobile (Green)
- Smartphones
- Typically shows:
- Shorter sessions
- Impulse purchases
- On-the-go decisions
- Lower average values (but high volume)
- Evening/weekend conversions
Tablet (Orange)
- iPads and Android tablets
- Typically shows:
- Behaviour between mobile and desktop
- Leisure browsing
- Evening/weekend usage
- Medium session lengths
- Comfortable shopping experience
Reading Stacked Percentages
Example interpretation:
Column: "2-7 Days"
- Desktop (Blue): 40% of column height
- Mobile (Green): 50% of column height
- Tablet (Orange): 10% of column height
Total: 100%
What this tells you:
- The 2-7 day bucket accounts for X% of all your conversions (look at the tooltip)
- Of those 2-7 day conversions:
- 40% happened on desktop
- 50% happened on mobile
- 10% happened on tablet
How to Read the Chart
Step 1: Identify Your Dominant Timeframe
Look at which column is tallest (represents the largest percentage of your conversions).
Example findings:
If "0-1 Days" is tallest (40%+):
- You have impulse-driven conversions
- Marketing creates immediate action
- Short consideration period
- Low-friction purchasing
If "2-7 Days" is tallest (30%+):
- Standard e-commerce pattern
- Some consideration but quick decisions
- Email/remarketing working well
- Moderate purchase complexity
If "8-14 Days" is tallest (25%+):
- Two-week consideration common
- Multi-touch journeys
- Research-driven purchases
- Mid-market products
If "15-30 Days" is tallest (20%+):
- Extended nurture required
- High-value or complex products
- Multiple touchpoints essential
- Email sequences critical
If "31-60 Days" or "61+" is tallest (15%+):
- Very long sales cycles
- High-commitment purchases
- Extended evaluation periods
- Enterprise or high-value sales
Understanding Days to Conversion
What "Days to Conversion" Means
Calculation: The number of days between:
- Start point: First tracked marketing touchpoint (first channel interaction)
- End point: Conversion completion
Important clarifications:
Start point is first tracked touch:
- May not be true first awareness
- Limited by your attribution window (typically 30-60 days)
- Offline influences (TV, print, word-of-mouth) not captured
End point is first path completion per session:
- Counts first conversion in each converting session
- Multiple conversions in one session = one data point
- Session-level, not visitor-level
Examples:
Example 1: Quick converter
- Monday 9am: Clicks paid search ad (first touch)
- Monday 2pm: Returns directly and converts
- Days to conversion: 0.2 days (5 hours) → Appears in "0-1 days" bucket
Example 2: Weekend researcher
- Saturday: Discovers brand via organic search (first touch)
- Saturday-Sunday: Researches, reads reviews
- Monday: Clicks paid ad and converts
- Days to conversion: 2 days → Appears in "2-7 days" bucket
Example 3: Email nurtured
- Day 1: Signs up via social media (first touch)
- Days 2-10: Receives nurture emails but doesn't click
- Day 11: Clicks email link and converts
- Days to conversion: 11 days → Appears in "8-14 days" bucket
Example 4: Long consideration
- January 5: First interaction via display ad
- January-February: Multiple touches (organic, email, paid)
- March 12: Final conversion
- Days to conversion: 66 days → Appears in "61+ days" bucket
What This Metric Does NOT Show
It doesn't show:
- Total awareness time: May have known your brand for years before first tracked touch
- Offline research: TV ads, magazine articles, word-of-mouth not captured
- Cross-device complete picture: Mobile research, desktop purchase shows as desktop conversion
- Between-session gaps: Only measures first touch to conversion, not active research time
- Multiple sessions from same visitor: Each converting session counted separately, even if same person
Troubleshooting
Issue: 61+ Bucket is Very High (30%+)
Possible causes:
- Attribution window too short:
- You have 30-day window but journeys are 60+ days
- Everything beyond window appears in 61+ bucket
-
Solution: Extend attribution window
Actually long sales cycle:
- High-value products genuinely take months
- B2B with lengthy procurement
-
Solution: This is normal, extend window and nurture
Tracking issues:
- First touch not being captured
- Gap in tracking causing false extended journeys
-
Solution: Audit tracking implementation
Seasonal effects:
- People researching months before need (holiday gifts)
- Solution: Segment by season
Issue: Distribution is Flat
Possible causes:
- Too broad a dataset:
- Multiple products with different timelines combined
- Various customer segments mixed
-
Solution: Segment by product, customer type, price point
Multiple business models:
- Mix of B2B and B2C
- Simple and complex products together
-
Solution: Separate analyses
Diverse catalogue:
- Marketplace or large e-commerce site
- Different product categories have different timelines
- Solution: Category-level analysis
Issue: Sudden Shift in Distribution
If your pattern changes dramatically:
Shift left (faster conversions):
Good reasons:
- ✓ Improved user experience
- ✓ Better targeting
- ✓ Streamlined checkout
- ✓ More effective remarketing
Bad reasons:
- ✗ Attribution window shortened
- ✗ Tracking changes
- ✗ Missing early touches
- ✗ Data quality issue
Shift right (slower conversions):
Acceptable reasons:
- ✓ Moving up-market (higher-value customers)
- ✓ More complex products
- ✓ Extended attribution window
Concerning reasons:
- ✗ Website problems adding friction
- ✗ Competitive pressure
- ✗ Economic factors
- ✗ Trust issues
How to diagnose:
- Check for website changes in that timeframe
- Review tracking configuration changes
- Examine concurrent campaigns
- Look for external factors (seasonality, competition)
- Validate data quality
Issue: All Conversions in 0-1 Days Bucket
This is suspicious and usually indicates:
- Attribution window issue:
- No first touches being captured
- Only capturing conversion event
-
Solution: Verify tracking of all touchpoints
Direct traffic overwhelming:
- All conversions appear as direct
- Marketing not tracked or attributed
-
Solution: Implement UTM parameters on all campaigns
Within-session conversions only:
- Only counting same-session conversions
- Not connecting sessions together
-
Solution: Check cookie-based identity tracking
Data configuration:
- First touch timestamp = conversion timestamp
- Solution: Review data pipeline
To validate:
- Check Journey Length KPI – should be >0 days average
- Review sample conversions for first touch data
- Verify cookie tracking enabled
Issue: No Data Showing
Checklist:
- Cookie tracking required:
- This chart needs cookie-based tracking
- Cookieless mode = empty chart
-
Solution: Enable cookie tracking for domain
Date range:
- No conversions in selected period
-
Solution: Extend date range
Filters too restrictive:
- Path/campaign filter eliminating all conversions
-
Solution: Remove filters one by one
Domain not selected:
- Need to select a domain
-
Solution: Select domain from filter
Insufficient permissions:
- User doesn't have access to domain
- Solution: Check permissions
Frequently Asked Questions
Q: Is faster always better?
A: Not necessarily. It depends on your business model.
Faster is better when:
- Lower customer acquisition costs
- Less remarketing spend needed
- Faster cash flow
- Higher campaign ROI
Slower might actually be fine when:
- Building relationships for high LTV customers
- Complex products that need education
- Premium positioning requires deliberation
- Multi-stakeholder decisions are necessary
Example: If you sell enterprise software with £100K contracts and 90-day sales cycles, a 45-day distribution isn't "slow" – it's efficient for your market.
The key: Match your timeline expectations to your product/market, not arbitrary "fast is better" thinking.
Q: How does this relate to the Journey Length KPI?
A: They measure the same thing from different angles.
Journey Length KPI:
- Single average number (e.g., "15.3 days")
- Shows overall trend (up or down)
- Good for quick snapshot
- Can hide distribution details
Days to Conversion Distribution:
- Shows full spread of data
- Reveals patterns (bimodal, skewed, etc.)
- Device breakdown
- More actionable insights
Both together:
- KPI tells you the average
- Chart tells you the story behind that average
Example:
- KPI: "Average 15 days"
- Chart might show: Bimodal (30% at 2 days, 30% at 30 days, average = 15)
- Insight: You have two distinct customer segments, not one "15-day" customer
Q: Why do I have conversions in the 0-1 day bucket if Journey Length shows 8 days average?
A: Because you have a mix:
- Some people convert immediately (0-1 days)
- Many more convert later (15-30 days)
- The average of these is 8 days
Think of it like a classroom:
- Some students score 90% (quick converters)
- Most students score 70% (normal converters)
- A few score 40% (slow converters)
- Class average: 68%
The average doesn't mean everyone scored 68%. Same with days to conversion.
Q: Should I try to shift everyone into the 0-1 day bucket?
A: Only if it makes sense for your product and doesn't sacrifice conversion quality.
Good reasons to accelerate:
- Removing genuine friction (slow checkout, broken forms)
- Improving clarity (confusing value prop)
- Better targeting (high-intent traffic)
Bad reasons:
- Pressure tactics that create returns/refunds
- Sacrificing customer quality for speed
- Ignoring that some products need research time
Better goal: Shift the distribution left while maintaining or improving:
- Conversion rate
- Average order value
- Customer lifetime value
- Return rate (lower is better)
Example:
- 0-1 day conversions: £50 average, 30% return rate
- 8-14 day conversions: £250 average, 5% return rate
In this case, don't push everyone to 0-1 days. The research time creates better purchase decisions.
Q: What if my distribution doesn't match any of your patterns?
A: Your business is unique. These patterns are guides, not rules.
Action steps:
- Document your actual pattern – this is your baseline
- Understand why it's shaped this way – product? market? customers?
- Set realistic goals – improve YOUR pattern, don't copy someone else's
- Segment if odd – unusual shapes often hide multiple segments
- Track over time – watch how YOUR pattern evolves
The pattern itself doesn't matter. What matters is:
- Understanding it
- Using it to inform strategy
- Tracking changes over time
- Aligning marketing with reality
Q: Can I trust this data if I have low volumes?
A: Be careful with small numbers.
Minimum volumes for reliable patterns:
- 200+ total conversions: Basic pattern identification
- 500+ conversions: Moderate confidence in distribution
- 1,000+ conversions: High confidence in pattern
- 5,000+ conversions: Very reliable, can segment deeply
With low volumes (<200):
- Patterns may be noise, not signal
- One large customer can skew distribution
- Don't over-optimize based on this data
- Use for hypothesis generation, not definitive strategy
Solution for low volume:
- Extend date range (90-120 days)
- Remove filters that limit data
- Wait for more data before major decisions
- Focus on aggregate KPIs instead