Conversion Path Flow Chart
The Conversion Path Flow chart is a visual funnel that shows exactly how visitors progress through your conversion path, revealing where they succeed and where they drop off.
What You'll See
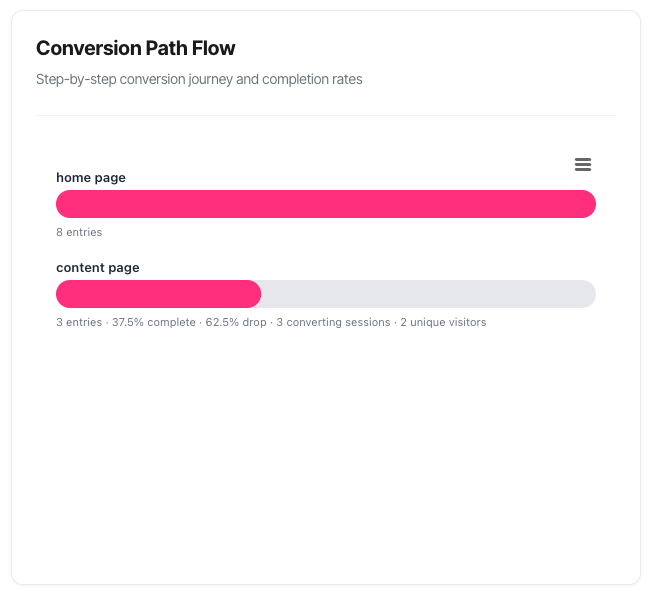
When you select a specific conversion path in your filters, a horizontal funnel chart appears displaying:
- Each step in your path listed from top to bottom in sequence
- Horizontal bars showing the relative volume at each step
- Detailed metrics beneath each bar including entries, completions, and conversions
- Visual flow from high volume at the top to lower volume as visitors progress
- Drop-off insights revealing exactly where people abandon the journey
The funnel updates automatically when you change your filters, giving you real-time insights into your conversion process.
Understanding the Funnel
Visual Design
Background Bars (Light Grey) These represent 100% – the maximum possible width based on your first step entries. They provide a consistent baseline for comparison across all steps.
Filled Bars (Pink) These show the actual volume at each step as a percentage of your first step entries. The width directly corresponds to how many people made it to that step.
Width = Success Wider bars mean more people progressed to that step. As visitors move through your funnel, the bars naturally get narrower as some people drop off at each stage.
The Anatomy of Each Step
Every step in your funnel displays:
1. Step Name (above the bar)
- The name you've configured for this step (e.g., "Product Page", "Add to Cart", "Checkout")
- Or a default like "Step 1", "Step 2" if no custom name set
2. Visual Bar
- Grey background showing maximum possible width
- Pink fill showing actual completion relative to first step
- Hover effect that highlights when you mouse over
3. Metrics Line (below the bar) Contains multiple pieces of information:
For All Steps:
- Entries: Number of sessions that reached this step
- Completion %: Percentage of first-step entries that made it here
- Drop-off %: Percentage who left between the previous step and this one (not shown for Step 1)
For Steps With Conversions:
- Converting sessions: Sessions that completed a conversion at this step (primary metric)
- Conversion events: Total conversion actions (shown in brackets if different from sessions)
- Unique visitors: Individual people who converted (shown when different from sessions)
How to Read the Funnel
Step Order and Flow
Top to Bottom = First to Last Your funnel reads like a story from top to bottom:
- First step (top): Where everyone enters
- Middle steps: Progressive qualification
- Final step (bottom): Conversion completion
Entry Counts
What they show: The number of sessions that reached each step during your selected time period.
Why they matter: Higher entry counts mean more people are progressing through your funnel. Significant drops between steps indicate friction points.
Example:
- Step 1 (Product Page): 5,247 entries
- Step 2 (Add to Cart): 1,574 entries
- Step 3 (Checkout): 892 entries
- Step 4 (Purchase): 421 entries
Interpretation:
- 70% drop from viewing to adding to cart (major friction point)
- 43% drop from cart to checkout (cart abandonment issue)
- 53% drop from checkout to purchase (payment friction)
Completion Percentages
What they show: The percentage of first-step entries that made it to each subsequent step.
Calculation: (Current step entries ÷ First step entries) × 100
Why it matters: Shows your overall funnel efficiency. Higher percentages mean better conversion flow.
Example:
- Step 1: [no percentage shown, this is the baseline]
- Step 2: 30.0% complete
- Step 3: 17.0% complete
- Step 4: 8.0% complete
Interpretation:
- Only 8% of people who started the journey completed a purchase
- You're losing 92% of potential customers along the way
- The biggest opportunity is likely in the early steps where volume is highest
Drop-off Percentages
What they show: The percentage of people who left between the previous step and this one.
Calculation: ((Previous step entries - Current step entries) ÷ Previous step entries) × 100
Why it matters: Pinpoints exactly where friction occurs in your funnel.
Example:
- Step 2: 70.0% drop (from Step 1 to Step 2)
- Step 3: 43.3% drop (from Step 2 to Step 3)
- Step 4: 52.8% drop (from Step 3 to Step 4)
Interpretation:
- The transition from browsing to cart is your biggest challenge (70% loss)
- Cart to checkout and checkout to purchase both need work (43% and 53% losses)
- Each step roughly halves your remaining audience
Converting Sessions (Primary Metric)
What they show: The number of unique sessions that completed a conversion at each step.
Important: This uses session-level counting, matching your KPI dashboard. One session is counted once even if it had multiple conversions.
When displayed: Only shown for steps where conversions actually occurred (typically the final step, but intermediate steps may have micro-conversions).
Example:
- Step 4: 421 entries · 8.0% complete · 52.8% drop · 398 converting sessions
Interpretation:
- 421 sessions reached the final step
- Of those, 398 completed a conversion
- 23 sessions reached purchase but didn't convert (abandoned at the last moment)
Conversion Events (Context Metric)
What they show: The total number of conversion actions that occurred.
When displayed: Only shown in brackets when different from converting sessions count, indicating multiple conversions within single sessions.
Example:
- 398 converting sessions (425 events)
Interpretation:
- 398 sessions converted
- Those sessions generated 425 conversion events
- Some sessions had multiple conversions (e.g., buying multiple products)
- 27 additional conversion events came from multi-purchase sessions
Unique Visitors (Context Metric)
What they show: The number of individual people who converted, counted once regardless of how many sessions they had.
When displayed: Only shown when different from converting sessions count, indicating repeat conversion behaviour.
Example:
- 398 converting sessions · 382 unique visitors
Interpretation:
- 398 sessions converted
- Those came from 382 unique individuals
- 16 converting sessions were repeat visitors returning to convert again
- You have loyal customers making multiple purchases!
Understanding the Different Metrics
Why Three Different Numbers?
Your funnel can show up to three different conversion-related metrics, and it's important to understand when and why each appears.
Converting Sessions (Always Primary):
- Definition: Unique sessions that resulted in a conversion
- Count method: Each session counted once, even with multiple conversions
- Why primary: Aligns with KPI dashboard, shows visit success rate
- Always shown: Yes (when conversions exist at that step)
Conversion Events (Contextual):
- Definition: Total number of conversion actions
- Count method: Every conversion counted separately
- Why contextual: Shows repeat purchase behaviour within sessions
- Shown when: Events count > Converting sessions count
Unique Visitors (Contextual):
- Definition: Individual people who converted
- Count method: Each person counted once across all their sessions
- Why contextual: Shows loyalty and repeat purchase patterns
- Shown when: Unique visitors < Converting sessions
Real-World Example
Let's say your funnel shows: 421 entries · 8.0% complete · 52.8% drop · 398 converting sessions (425 events) · 382 unique visitors
What actually happened:
- 421 sessions reached the final step
- 398 of those sessions completed at least one conversion
- Those 398 sessions generated 425 total conversion events (some bought multiple items)
- Those 398 sessions came from 382 unique people (16 were returning customers)
Why this matters:
- Primary insight: 94.5% of sessions that reach checkout actually convert (398/421)
- Bonus insight 1: Your customers buy multiple items (425 events from 398 sessions)
- Bonus insight 2: You have loyal repeat customers (16 return conversions)
Cookie Tracking vs Cookieless Mode
Cookie Tracking Enabled (Most Accurate): Shows all three metrics:
- Converting sessions (always)
- Conversion events (when different)
- Unique visitors (when different)
Cookieless Mode (Privacy-Focused): Shows simplified metrics:
- Entries (always)
- Conversions (aggregate count at final step)
- Limited journey tracking
How to tell which mode you're in: If you see "converting sessions" and "unique visitors" metrics, you're in cookie tracking mode. If you only see "conversions" as a simple count, you're in cookieless mode. You can also check the tracking mode in manage session tracking.
Practical Use Cases
1. Identifying Your Biggest Problem
Scenario: You need to know where to focus your optimisation efforts first.
How to use the funnel:
- Look at the drop-off percentages for each step
- Identify the step with the highest drop-off
- Note the entry count at that step (higher volume = bigger opportunity)
- Prioritise high-drop-off + high-volume steps
Example analysis:
- Step 1→2: 70% drop, 5,247 entries = 3,673 lost sessions (HUGE OPPORTUNITY)
- Step 2→3: 43% drop, 1,574 entries = 682 lost sessions
- Step 3→4: 53% drop, 892 entries = 471 lost sessions
Action: Focus on Step 1→2. Even a 10% improvement in this step (reducing drop from 70% to 60%) would add 525 sessions to Step 2, potentially resulting in 42 more conversions!
2. Calculating Conversion Potential
Scenario: You want to understand the impact of improvements at each step.
How to calculate:
- Note current drop-off percentage
- Set an improvement target (e.g., reduce drop by 10 percentage points)
- Calculate sessions saved: (Previous step entries) × (Drop reduction ÷ 100)
- Project down the funnel using current conversion rates
Example:
- Current Step 2 drop: 70%
- Improvement target: 60% drop
- Step 1 entries: 5,247
- Sessions saved: 5,247 × (10% ÷ 100) = 525 additional sessions at Step 2
Cascade effect:
- 525 more at Step 2 → ~298 more at Step 3 (using 43% drop rate)
- ~298 more at Step 3 → ~141 more at Step 4 (using 53% drop rate)
- Net result: ~141 additional conversions from one improvement!
3. Comparing Path Performance
Scenario: You have multiple conversion paths and want to know which performs best.
How to compare:
- Switch between paths using the Path filter
- Export screenshots of each funnel
- Create a comparison table:
| Metric | Path A (Purchase) | Path B (Trial Signup) | Path C (Contact) |
|---|---|---|---|
| First step entries | 5,247 | 3,891 | 1,204 |
| Final step completion | 8.0% | 24.5% | 42.1% |
| Biggest drop point | Step 1→2 (70%) | Step 2→3 (35%) | Step 1→2 (45%) |
| Total conversions | 421 | 953 | 507 |
Insights:
- Path C has best completion rate but lowest volume
- Path B balances volume and conversion well
- Path A has highest volume but major friction at step 1
- Focus optimisation: Path A (biggest opportunity)
4. Evaluating Redesigns
Scenario: You redesigned your checkout process and want to measure impact.
How to evaluate:
- Export the "before" funnel (previous 30 days before change)
- Wait 14 days after implementing change
- Export the "after" funnel (14 days after change)
- Compare the funnels side by side
What to look for:
- Did entries to each step change?
- Did drop-off percentages improve?
- Did the problem step get better or worse?
- Any unexpected negative impacts on other steps?
Example results:
- Step 3→4 drop: 53% → 38% (15 point improvement!)
- Step 3 entries: 892 → 910 (slight increase)
- Estimated impact: 141 additional conversions per month
5. Seasonal Planning
Scenario: You want to understand how traffic and conversion patterns change seasonally.
How to analyse:
- View funnel for same 30-day period last quarter
- View current period
- Compare entry volumes and completion percentages
What to look for:
- Volume changes (more/less traffic)
- Behaviour changes (different drop-off rates)
- Conversion quality (same completion % with different volume)
Example seasonal insights:
- Holiday traffic: 3× volume but 20% worse conversion (different intent)
- January: 50% volume drop but 30% better conversion (serious buyers)
- Action: Adjust marketing mix and inventory planning accordingly
6. Campaign Quality Assessment
Scenario: You're running multiple marketing campaigns and want to know which drives quality traffic.
How to evaluate:
- Use the Campaign filter to select a specific campaign
- Note the overall completion percentage
- Identify where that campaign's traffic drops off
- Repeat for other campaigns
- Compare funnels
Example findings:
Campaign A (Search Ads):
- 1,204 first-step entries
- 12.5% completion rate
- Best step: Step 3→4 (only 28% drop)
Campaign B (Social Media):
- 2,891 first-step entries
- 4.2% completion rate
- Worst step: Step 1→2 (82% drop – wrong audience!)
Action: Campaign A drives fewer visitors but higher quality. Campaign B needs better targeting or different landing pages for social traffic.
7. Mobile vs Desktop Analysis
Scenario: You suspect mobile users have a worse experience but want data.
How to analyse:
- View funnel with no device filter (baseline)
- Apply mobile device filter
- Export mobile funnel
- Apply desktop device filter
- Export desktop funnel
- Compare drop-off rates at each step
Example findings:
Desktop:
- Overall completion: 11.2%
- Biggest drop: Step 1→2 (62%)
Mobile:
- Overall completion: 4.8%
- Biggest drop: Step 3→4 (71% – checkout problems!)
Interpretation: Mobile users navigate to checkout okay, but abandon during payment. Likely issues: form complexity, loading speed, or payment options.
Action: Prioritise mobile checkout optimisation – biggest impact opportunity.
Common Funnel Patterns
Pattern 1: Classic Funnel (Steady Narrowing)
What it looks like:
- Consistent drop-off at each step
- Roughly 30-50% drop per step
- Smooth visual taper from top to bottom
What it means:
- Normal, healthy funnel
- No major friction points
- Consistent user qualification at each stage
Example:
- Step 1: 1,000 entries
- Step 2: 650 entries (35% drop)
- Step 3: 390 entries (40% drop)
- Step 4: 234 entries (40% drop)
Action: Focus on incremental improvements. Test changes at high-volume steps for maximum impact.
Pattern 2: Cliff Drop (One Major Problem)
What it looks like:
- One step has dramatically higher drop-off than others
- Visual "cliff" where the bar suddenly becomes much narrower
- Other steps have reasonable drop rates
What it means:
- Specific friction point
- Single major barrier in your funnel
- High-impact optimisation opportunity
Example:
- Step 1: 1,000 entries
- Step 2: 250 entries (75% drop – CLIFF!)
- Step 3: 200 entries (20% drop)
- Step 4: 150 entries (25% drop)
Action: Investigate the cliff step immediately:
- Is the ask too big?
- Is the value proposition unclear?
- Are there technical issues?
- Is there a better intermediate step needed?
Common cliff locations:
- Account creation (Step 1→2): Too much friction too early
- Payment information (Step 3→4): Trust or security concerns
- Unexpected costs (any step): Surprise fees kill conversions
Pattern 3: Strong Start, Weak Finish
What it looks like:
- Low drop-off in early steps
- Much higher drop-off in later steps
- Good engagement but poor conversion
What it means:
- Your early experience is good
- Final steps have problems
- Likely trust, pricing, or commitment issues
Example:
- Step 1: 1,000 entries
- Step 2: 850 entries (15% drop)
- Step 3: 700 entries (18% drop)
- Step 4: 280 entries (60% drop – PROBLEM)
Action: Your attraction and engagement work, but closing needs work:
- Are you asking for too much too late?
- Is pricing only visible at the end?
- Are there unexpected requirements?
- Do you need stronger trust signals?
Pattern 4: Weak Start, Strong Finish
What it looks like:
- High drop-off in early steps
- Lower drop-off in later steps
- Small but highly qualified audience
What it means:
- Strong qualification happening early
- Those who stay are highly motivated
- May be leaving money on the table
Example:
- Step 1: 1,000 entries
- Step 2: 200 entries (80% drop – BARRIER)
- Step 3: 160 entries (20% drop)
- Step 4: 136 entries (15% drop)
I
nterpretation: Could be good or bad:
Good version: You've set up effective qualification
- B2B product requiring enterprise readiness
- High-value item with appropriate screening
- Professional service with specific criteria
Bad version: You're unnecessarily filtering out potential customers
- Asking for commitment too early
- Unclear value proposition
- Poor initial user experience
Action: Evaluate if early barriers are strategic or accidental. Consider whether you can nurture more people through the early stages without sacrificing quality.
Pattern 5: Multi-Peak (Scattered Conversions)
What it looks like:
- Conversions showing up at multiple steps
- Not just at the final step
- Different entry and conversion volumes at various stages
What it means:
- Multiple conversion opportunities in your path
- Some users convert early, others later
- Flexible path allowing different user journeys
Example:
- Step 2: 850 entries · 42 converting sessions
- Step 4: 700 entries · 118 converting sessions
- Step 6: 280 entries · 156 converting sessions (final)
Interpretation:
- Micro-conversions set up at interim steps
- Some users satisfied with partial completion
- "Quick wins" captured before final commitment
Action: Analyse which conversions are most valuable. Consider nurturing early converters toward full completion.
Pattern 6: Uniform High Drop-off
What it looks like:
- High drop-off rates (>60%) at every single step
- Very few people making it through
- Extremely narrow final bar
What it means:
- Fundamental problems throughout the funnel
- Either wrong audience or broken experience
- Nothing is working well
Example:
- Step 1: 1,000 entries
- Step 2: 250 entries (75% drop)
- Step 3: 62 entries (75% drop)
- Step 4: 15 entries (76% drop) = 1.5% completion
A
ction: Emergency mode
- Verify tracking is working correctly
- Check for bot traffic inflating entry counts
- Review target audience – are you attracting the wrong people?
- Test the entire user journey yourself
- Consider whether the steps are in the right order
- Evaluate if the value proposition matches the ask
Troubleshooting Common Issues
Issue: Funnel Shows "Please select a path"
Cause: No conversion path currently selected in your filters.
Solution:
- Look at the filter bar at the top of the dashboard
- Click the "Path" dropdown
- Select a specific conversion path
- The funnel will load automatically
Issue: Funnel Shows "No funnel data available"
Possible causes:
1. Insufficient data in date range:
- Try extending your date range from 7 to 30 or 60 days
- Check if the path was active during this period
2. Path recently created:
- New paths take time to accumulate data
- Wait for visitors to progress through the steps
3. Tracking issues:
- Verify tracking code is installed on all step pages
- Check that FlowSpecific events are firing
- Review browser console for errors
4. No traffic:
- Confirm your website is receiving visitors
- Check other analytics tools for validation
Issue: Drop-off Seems Unrealistically High (90%+)
Possible causes:
1. Wrong audience (Most common):
- Traffic source not aligned with offer
- Misleading ad copy or content
- Wrong keywords attracting irrelevant visitors
Solution: Review traffic sources using Campaign filter. Focus on quality over quantity.
2. Major UX problem:
- Broken forms or links
- Page not loading properly
- Mobile compatibility issues
Solution: Test the complete user journey on multiple devices.
3. Value proposition mismatch:
- Landing page doesn't match visitor expectations
- Benefits not clear enough
- Price not justified by perceived value
Solution: A/B test value proposition. Add testimonials and social proof.
4. Technical barriers:
- Long load times
- Required account creation
- Too many form fields
Solution: Run technical audit. Simplify requirements.
Issue: Very Low Entry Counts Despite High Traffic
Possible causes:
1. Tracking not configured:
- Events not set up correctly
- FlowSpecific parameter missing
- Wrong PathID in tracking code
Solution: Review tracking implementation. Test events firing.
2. Campaign filter too restrictive:
- Currently filtering to specific campaign with little traffic
- Campaign parameter spelling incorrect
Solution: Try "All Campaigns" filter to see full picture.
3. Wrong step URLs configured:
- Path steps point to pages people don't visit
- URLs contain query parameters not matching
Solution: Review path configuration. Update step URLs.
Issue: No Conversions Showing Despite Entries
Possible causes:
1. Conversions only at final step:
- This is normal behaviour
- Intermediate steps show entries only
- Conversions appear at path completion
Solution: This is expected. No action needed.
2. Path completion not firing:
- Conversion event not triggered
- is_path_completion flag not set correctly
Solution: Review conversion tracking code. Test completion event.
3. Date range issue:
- Entries happened but conversions not yet (long sales cycle)
- Looking at current day's data still processing
Solution: Extend date range or wait for data processing.
Issue: Numbers Don't Match Other Reports
Common reasons:
1. Different counting methodologies:
- Funnel uses session-level counting
- Other tools may use visitor or event counting
- Both can be "correct" with different definitions
2. Different time windows:
- Funnel uses selected date range
- Other reports may use different periods
- Attribution windows differ
3. Different filters applied:
- Campaign filter changes numbers
- Device filters affect results
- Date range boundaries vary
Solution: Focus on trends within each tool rather than expecting exact matches. Use SERP360 for attribution insights and overall trends.
Frequently Asked Questions
Q: Why do I only see conversions at the final step?
A: This is expected behaviour for most paths. Conversions represent path completions, which only happen when someone reaches the end. Intermediate steps show entries and drop-offs, not conversions. If you want to track partial completions, set up separate conversion paths for those intermediate goals.
Q: What's a "good" drop-off percentage?
A: It varies enormously by industry, path complexity, and step type. As general guidelines:
- Simple paths (2-3 steps): 30-50% average drop per step
- Complex paths (4-6 steps): 40-60% average drop per step
- High-commitment actions: 70%+ drop is common at critical steps
Focus on improving YOUR baseline rather than hitting arbitrary benchmarks.
Q: Should I be concerned if converting sessions ≠ unique visitors?
A: No, that's actually good news! When unique visitors is lower than converting sessions, it means some customers liked your product so much they came back to buy again. That's loyalty and repeat business – exactly what you want.
Q: Why can't I see visitor-level metrics?
A: You're likely in cookieless tracking mode for this domain. Cookieless mode provides privacy-focused analytics but with reduced journey tracking. You'll see entries and aggregate conversions, but not detailed visitor tracking across sessions.
Q: How do I improve a step with 80%+ drop-off?
A:
- Test the journey yourself – what's confusing or broken?
- Watch session replays of users who drop off
- Check if it's a traffic quality issue (wrong audience)
- Consider adding an intermediate step to reduce the ask
- A/B test radical changes, not minor tweaks
- Get user feedback through surveys or interviews
Q: Can I export the funnel data?
A: Yes! Use the export menu (☰) in the top-right corner to download as PNG, JPEG, PDF, or SVG for presentations and reports.
Q: What if my first step has very few entries despite high website traffic?
A: This indicates a tracking configuration issue. Your path steps may be set to URLs that visitors don't actually visit, or your tracking code isn't firing correctly on those pages. Review your path configuration and tracking implementation.