Keyword Distribution
Keyword distribution shows where your keywords rank across different position ranges. You'll see how many keywords sit in positions 1-3, 4-10, 11-20, and beyond.
This visualisation reveals your ranking profile at a glance. Strong distribution in top positions means your SEO strategy works.
Why distribution matters
Rankings cluster in patterns. Sites with authority dominate positions 1-3. Growing sites build strength in positions 4-20. Understanding your pattern guides your next moves. Distribution changes reveal progress. Keywords climbing from 21-50 into 11-20 signal momentum. Drops from 4-10 to 11-20 flag problems early.
Find the distribution chart
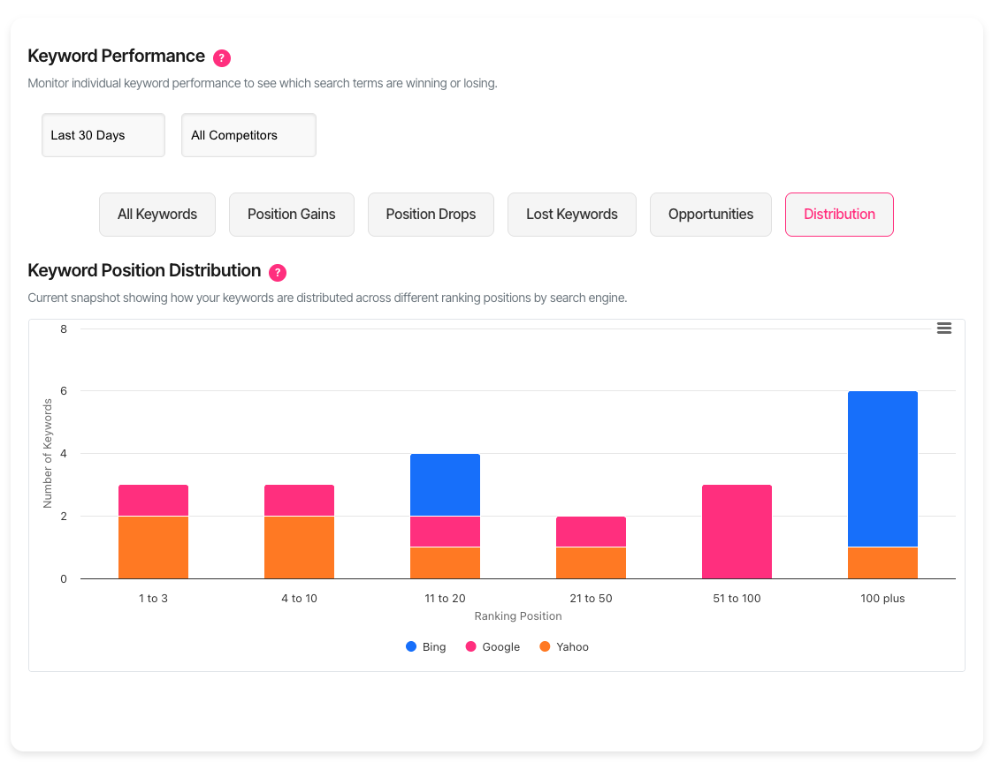
Navigate to the Keywords dashboard. Select the Distribution tab. You'll see a stacked column chart. Each column represents one position range. The height shows how many keywords rank there.
Read the chart
The chart divides rankings into six ranges. Each range appears as a separate column.
1 to 3 — Your prime positions. These keywords drive the most traffic.
4 to 10 — Strong positions that capture clicks. Still first-page results.
11 to 20 — Second-page territory. Close to breaking through.
21 to 50 — Mid-range positions. Opportunities for improvement.
51 to 100 — Lower rankings. Often need significant work.
100 plus — Keywords ranking beyond position 100. Consider whether they're worth pursuing.
Multiple search engines
When you track multiple search engines, the chart stacks them within each column. Different colours represent different engines. Hover over any section to see exact keyword counts for that engine and position range.
Filter by search group
Use your search group dropdown to focus on specific domain sets. The chart updates instantly. This lets you compare distribution patterns across different search configurations, clients or projects. Each project reveals its own ranking profile.
Filter by category
Select a category from the category dropdown. You'll see distribution for just those keywords. Categories let you analyse topic-specific performance. Your blog posts might cluster differently than your product pages.
Combine filters strategically
Stack search group and category filters together. You'll isolate precise segments of your keyword portfolio. This combination answers questions like "How do my client's product keywords distribute?" or "Where do industry news terms rank?"
Interpret your distribution
Healthy patterns
Strong sites show pyramid shapes. Lots of keywords in positions 1-3, fewer in 4-10, progressively less in lower ranges. This pattern means your authority compounds. Top rankings pull other keywords up.
Growth patterns
Developing sites often show inverted pyramids. More keywords sit in positions 11-50 than in top positions. This signals potential. You're gaining traction. Focus on moving these mid-range keywords up.
Problem patterns
Flat distributions spread keywords evenly across ranges. No clear strength emerges. This suggests unfocused strategy. You're ranking for many terms but dominating none.
Track progress over time
Watch how your keyword counts shift between ranges. Growing 1-3 counts mean your SEO gains momentum. Shrinking 4-10 counts might flag content decay or increased competition.
Make strategic decisions
Prioritise quick wins
Keywords in positions 11-20 sit closest to page one. Small improvements move them up. Target these first. Optimise content, build links, improve engagement metrics.
Protect top positions
Keywords in 1-3 positions deliver disproportionate value. Monitor them closely. If these counts drop, investigate immediately. Competitors might be targeting your strongest terms.
Assess mid-range investment
Large counts in 21-50 or 51-100 ranges require decisions. Can you realistically move them up? Sometimes abandoning weak performers frees resources for stronger opportunities.
Understand engine differences
When multiple engines stack in columns, compare their patterns. You might dominate Google but struggle on Bing. This reveals where to focus engine-specific optimisation efforts.
When data doesn't appear
If the chart shows "No data", check these scenarios:
No keywords tracked for your selected filters. Add keywords or broaden your selection.
No recent ranking data exists. Run fresh keyword checks to populate distribution.
Filter combination eliminates all results. Try selecting "All Categories" or a different search group.
Data freshness
Distribution reflects your most recent keyword checks.
Get support
Need help interpreting your distribution patterns? Contact our support team through the help icon in your dashboard.