AI Conversation Sentiment Analysis
Conversation Sentiment Analysis reveals how AI platforms describe your brand at each stage of the customer journey. It tracks whether AI responses frame your brand positively, negatively, or with mixed sentiment—helping identify where brand perception needs attention.
Quick start
1. Select 30 Days and the target Project
2. Check the blue (positive) segment height across phases
3. Compare sentiment at Decision phase to earlier phases
4. Use Provider Position to focus on top recommendations
Understanding the display
Sentiment analysis categorises how AI platforms describe your brand when they mention it. Each response where your brand appears is classified as positive, mixed, negative, or unknown based on the language used.
Sentiment categories
| Sentiment | Colour | Meaning |
| Positive | Blue | AI describes your brand favourably—recommending, praising, or highlighting strengths |
| Mixed | Orange | AI presents both positives and negatives, or uses neutral language |
| Negative | Pink | AI describes concerns, limitations, or unfavourable comparisons |
| Unknown | Grey | Sentiment could not be determined from the response |
Phase breakdown view (Yesterday)
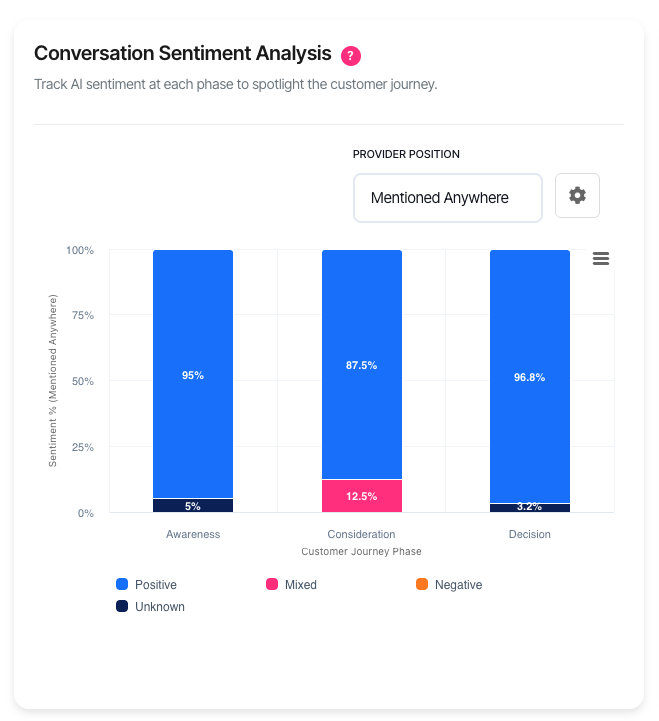
When "Yesterday" is selected, the chart displays as a stacked column chart showing sentiment distribution by customer journey phase:
| Element | Description |
| X-axis | Customer journey phases (Awareness, Consideration, Decision) |
| Y-axis | Percentage of responses |
| Stacked segments | Each colour shows the proportion of that sentiment type |
| Segment height | Taller segments indicate more responses with that sentiment |
The phase breakdown reveals sentiment patterns across the buying journey. Strong positive sentiment at Awareness but declining at Decision indicates a potential conversion issue.
Trend view (7+ days)
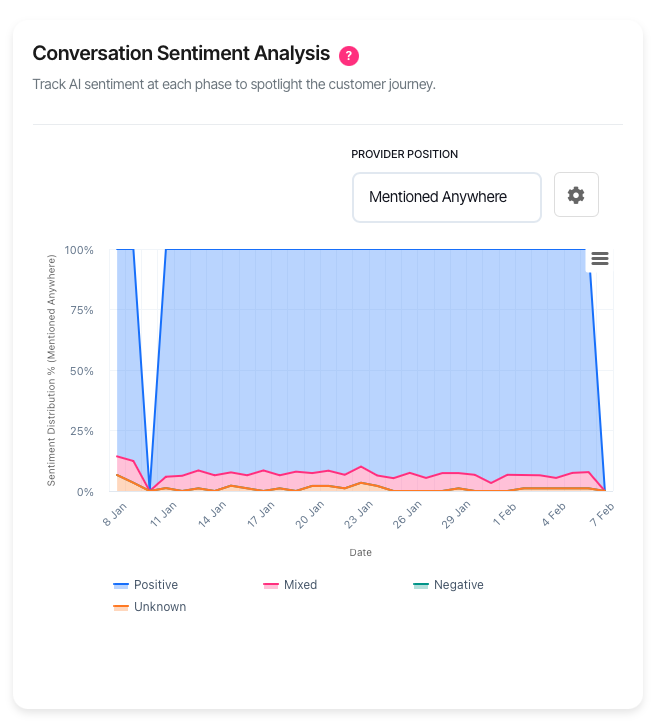
When the date range spans 7 days or more, the chart displays as a 100% stacked area chart showing sentiment distribution over time:
| Element | Description |
| X-axis | Dates across the selected period |
| Y-axis | Percentage distribution (always totals 100%) |
| Area bands | Each colour shows the proportion of that sentiment type |
| Band width | Wider bands indicate more responses with that sentiment |
The trend view reveals whether sentiment is improving, declining, or stable over time. A growing blue (positive) band indicates improving brand perception.
What should I do next?
Sentiment patterns guide reputation and content strategy:
| Pattern | Action |
| High positive at all phases | Strong brand perception. Maintain current positioning. |
| Positive at Awareness, declining at Decision | AI platforms aren't confident recommending you. Strengthen decision-stage content. |
| High negative sentiment | Review AI responses to identify specific concerns. Address in content. |
| High mixed sentiment | AI sees both pros and cons. Clarify your value proposition. |
| Sentiment declining over time | Competitors may be improving. Review their positioning. |
| Sentiment improving over time | Content changes are working. Continue the approach. |
Using the filters
Provider Position
Filter sentiment by where your brand appears in AI responses:
| Option | Measures |
| Mentioned Anywhere | Sentiment across all mentions (default) |
| Top 3 Recommendations | Sentiment when your brand is in the top 3 |
| #1 Recommendation | Sentiment when your brand is the top recommendation |
Sentiment at #1 Recommendation matters most for conversions—it shows how AI platforms describe your brand when actively recommending it.
Date range
The date range determines both the data period and the chart display mode:
| Option | Display mode | Best for |
| Yesterday | Phase breakdown (columns) | Current sentiment by journey stage |
| 7 Days | Trend (area chart) | Recent sentiment changes |
| 30 Days | Trend (area chart) | Trend analysis (default) |
| 90 Days | Trend (area chart) | Quarterly sentiment patterns |
| 180 Days | Trend (area chart) | Long-term reputation tracking |
Platform
Filter to a specific AI platform to analyse sentiment on that system. Sentiment varies across platforms—ChatGPT may perceive your brand differently than Claude or Gemini.
Phase filter
Focus on a single customer journey phase. Sentiment at Decision phase directly influences conversions—negative sentiment here loses potential customers.
Chart settings
Click the settings icon (⚙) to open the Chart Settings modal.
Group your brands
When enabled (default), sentiment is measured across all your configured brands combined. This shows overall brand portfolio perception.
When disabled, select specific brands to analyse. This helps identify whether sentiment differs between your product lines or sub-brands.
Brand selection
When grouping is disabled, select up to 12 brands to include in the analysis. Only sentiment for selected brands is measured.
Session only: Brand selections reset when you leave the page.
Interactive features
• Hover over any segment to see exact percentage
• Click legend items to show or hide specific sentiment categories
• Export via the menu icon (⋮) to download as PNG, JPEG, or SVG
Troubleshooting
No sentiment data available
Sentiment requires your brand to appear in AI responses with analysable language.
• Expand the date range to capture more data
• Set Provider Position to "Mentioned Anywhere" for maximum data
• Select "All" for platform and phase filters
• Verify brands are configured in AI Visibility Settings
High percentage of unknown sentiment
"Unknown" indicates the system could not determine sentiment from the response.
• Some AI responses use factual language without sentiment
• Brief mentions may not contain enough context to classify
• This is normal—focus on the known sentiment distribution
Chart shows columns instead of area chart
The chart has two display modes based on date range:
• Yesterday: Stacked column chart showing phase breakdown
• 7+ days: Stacked area chart showing trends over time
This is expected behaviour. Select 7 Days or longer to see the trend chart.
FAQ
How is sentiment determined?
Sentiment is extracted from the language AI platforms use when mentioning your brand. Positive sentiment includes recommendations, praise, and favourable comparisons. Negative sentiment includes concerns, limitations, and unfavourable comparisons. Mixed sentiment indicates balanced or neutral language.
Why does sentiment differ by phase?
AI platforms answer different types of questions at each phase. Awareness questions are general, so sentiment tends toward neutral. Decision questions ask for recommendations, where AI platforms express clearer preferences—positive or negative.
How often does data update?
Data updates daily. Exact timing depends on account configuration.
What's the difference between sentiment and visibility?
Visibility measures whether your brand is mentioned. Sentiment measures how it's described when mentioned. High visibility with negative sentiment is worse than low visibility with positive sentiment—it means AI platforms mention your brand but discourage it.
Why does sentiment differ by platform?
Each AI platform has different training data and phrasing styles. Some platforms use more enthusiastic language; others are more reserved. Cross-platform sentiment differences may reflect style as much as perception.
Can I see the actual AI responses?
The Sentiment Analysis chart shows aggregate patterns. To see individual responses, use the AI Conversation Responses feature to browse specific answers.
Getting help
Contact support for data issues or unexpected patterns