AI Visibility Competitive Win Rate
Competitive Win Rate measures how often your brand ranks higher than competitors in AI responses. When both your brand and a competitor appear in the same response, the brand mentioned first wins. This reveals whether AI platforms prefer your brand over competitors.
Quick start
1. Select 30 Days and the target Project
2. Find "Your Brands" line in the chart
3. Check if it sits above or below the 50% line
4. Click the settings icon (⚙) to compare against specific competitors
Understanding the display
Win rate shows how often your brand beats competitors when both appear in the same AI response. A 60% win rate means your brand ranked higher in 60% of head-to-head encounters. The chart automatically switches between two display modes based on the selected date range.
How wins are determined
An encounter occurs when your brand and at least one competitor both appear in the same AI response. The brand mentioned first (lowest rank number) wins that encounter.
| Scenario | Result |
| Your brand mentioned first | You win |
| Competitor mentioned first | Competitor wins |
| Only your brand mentioned | No encounter (not counted) |
| Only competitors mentioned | No encounter (not counted) |
Time-series view (7+ days)
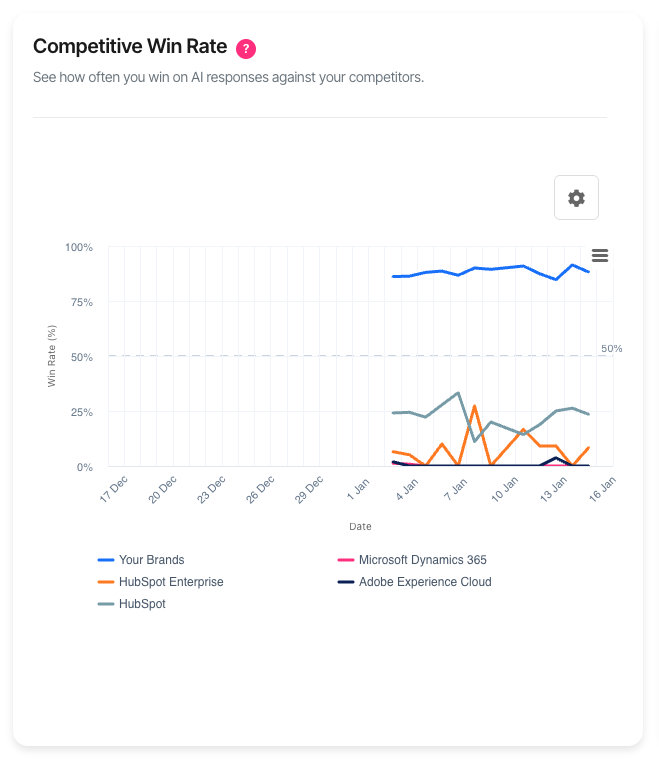
When the date range spans 7 days or more, the chart displays as a line graph showing win rate trends over time:
| Element | Description |
| X-axis | Dates across the selected period |
| Y-axis | Win rate percentage (0–100%) |
| Coloured lines | Each brand's win rate over time |
| 50% reference line | The break-even point—above means winning more than losing |
| Your Brands | Your combined win rate against all competitors |
The 50% line is critical: consistently above means AI platforms prefer your brand; consistently below means competitors are favoured.
Snapshot view (Yesterday)
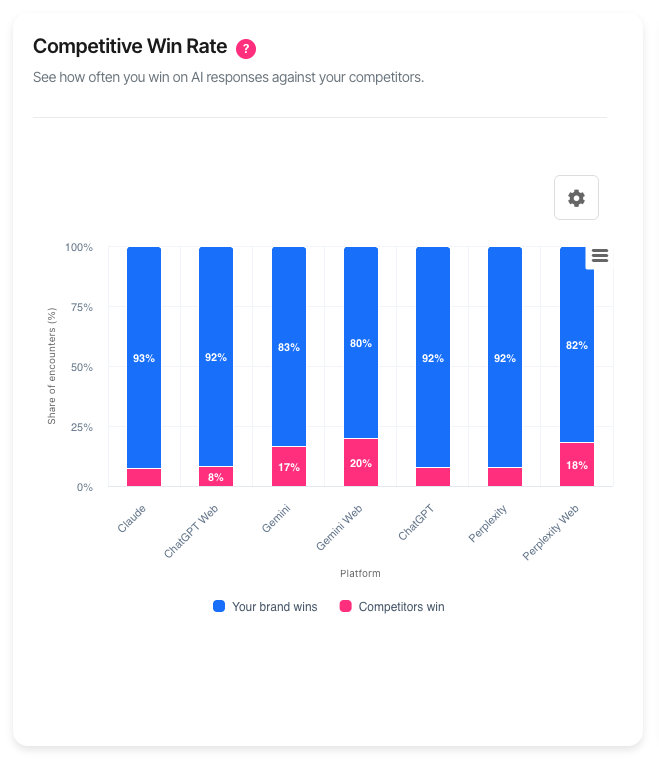
When "Yesterday" is selected, the chart displays as a stacked bar chart showing wins versus losses by AI platform:
| Element | Description |
| X-axis | AI platforms (ChatGPT, Claude, Gemini, etc.) |
| Y-axis | Percentage of encounters |
| Green section | Encounters your brand won |
| Red section | Encounters competitors won |
The snapshot view reveals which platforms favour your brand and which favour competitors.
What should I do next?
Win rate patterns indicate competitive positioning:
| Pattern | Action |
| Consistently above 50% | Strong position. Maintain current content strategy. |
| Consistently below 50% | Competitors are preferred. Analyse their content for gaps. |
| Win rate declining | Competitors are improving. Review their recent changes. |
| Win rate rising | Your improvements are working. Continue the strategy. |
| High variance day-to-day | Position is unstable. Focus on consistency. |
| Strong on one platform, weak on another | Tailor content strategy per platform. |
Using the filters
Date range
The date range determines both the data period and the chart display mode:
| Option | Display mode | Best for |
| Yesterday | Stacked bar chart | Platform-by-platform competitive check |
| 7 Days | Line chart (trends) | Recent competitive shifts |
| 30 Days | Line chart (trends) | Trend analysis (default) |
| 90 Days | Line chart (trends) | Quarterly competitive patterns |
| 180 Days | Line chart (trends) | Long-term competitive position |
Platform
Filter to a specific AI platform to analyse competitive position on that system. Win rates vary significantly across platforms—understanding platform-specific performance guides targeted improvements.
Phase filter
Focus on a single customer journey phase. Win rate at the Decision phase matters most for conversions—this shows which brand AI platforms recommend when users are ready to purchase.
Chart settings
Click the settings icon (⚙) to open the Chart Settings modal. Settings are available in time-series view (7+ days).
Group your brands
When enabled (default), all your configured brands combine into a single "Your Brands" series. Win rate is calculated using the best-ranked of your brands in each encounter.
When disabled, each of your brands appears as a separate series with its own win rate. This helps compare performance between your product lines.
Competitor selection
The chart displays up to 9 series total: your brands (grouped or individual) plus competitors. Each competitor's line shows their win rate against all other brands.
Click competitors in the "Add Competitors" list to include them. Click the × on any selected series to remove it. Changes apply when you click "Apply".
Default competitors: If configured in AI Visibility Settings, your default competitors appear automatically.
Session only: Competitor selections reset when you leave the page. Configure defaults in AI Visibility Settings to make them permanent.
Interactive features
• Hover over any point to see exact date, brand, and win rate
• Click legend items to show or hide specific brands
• Export via the menu icon (⋮) to download as PNG, JPEG, or SVG
Troubleshooting
No competitive encounters found
Win rate requires your brand and competitors to appear in the same AI responses.
• Expand the date range to capture more data
• Select "All" for platform and phase filters
• Verify brands and competitors are configured in AI Visibility Settings
• Your brand may not compete directly with tracked competitors
Win rate shows 0%
A 0% win rate means competitors ranked higher in every encounter.
• Review competitor content to identify what makes them preferred
• Check if brand names match how AI platforms reference your company
• Expand the date range—small sample sizes can show extreme results
Chart shows bars instead of lines
The chart has two display modes based on date range:
• Yesterday: Stacked bar chart showing wins vs losses by platform
• 7+ days: Line chart showing win rate trends over time
This is expected behaviour. Select 7 Days or longer to see the line chart with competitor comparisons.
Gaps in the line chart
Gaps appear when no competitive encounters occurred on those days. This happens when:
• Your brand and competitors did not appear together in any responses
• No AI monitoring ran that day
• Filters exclude all data for that day
FAQ
How is win rate calculated?
Win rate equals wins divided by total encounters, expressed as a percentage. An encounter is any AI response where both your brand and at least one competitor appear. The brand mentioned first (lowest rank) wins.
Why is 50% the benchmark?
At 50%, you win as often as you lose—a neutral position. Above 50% means AI platforms generally prefer your brand. Below 50% means competitors are generally preferred.
How often does data update?
Data updates daily. Exact timing depends on account configuration.
What's the difference between Win Rate and Share of Voice?
Share of Voice measures total mention volume (how much of the conversation you own). Win Rate measures head-to-head preference (when both appear, who ranks higher). High share of voice with low win rate means you're mentioned often but not preferred.
Why does my win rate differ by platform?
Each AI platform uses different training data and algorithms. A competitor strong on ChatGPT may be weaker on Claude. Use the snapshot view to identify platform-specific patterns.
Can I see win rate against a specific competitor?
The current view shows each brand's win rate against all others. To analyse a specific head-to-head, select only that competitor in Chart Settings—your win rate will then reflect encounters with that single competitor.
Getting help
Contact support for data issues or unexpected behaviour