Customer Journey Phase Progression
The Customer Journey Phase Progression chart tracks daily brand visibility across three buying stages: Awareness, Consideration, and Decision. It reveals where AI platforms mention your brand and highlights gaps in the customer journey.
Quick start
1. Select 30 Days and the target Project
2. Compare the three phase lines
3. Focus on phases where visibility drops below 20%
4. Click the settings icon (⚙) to filter by specific brands
Understanding the display
The chart displays visibility percentage (0–100%) for each customer journey phase. Higher visibility means AI platforms mention your brand more frequently in that phase. The chart automatically switches between two display modes based on the selected date range.
Time-series view (7+ days)
When the date range spans 7 days or more, the chart displays as a line graph showing daily visibility trends:
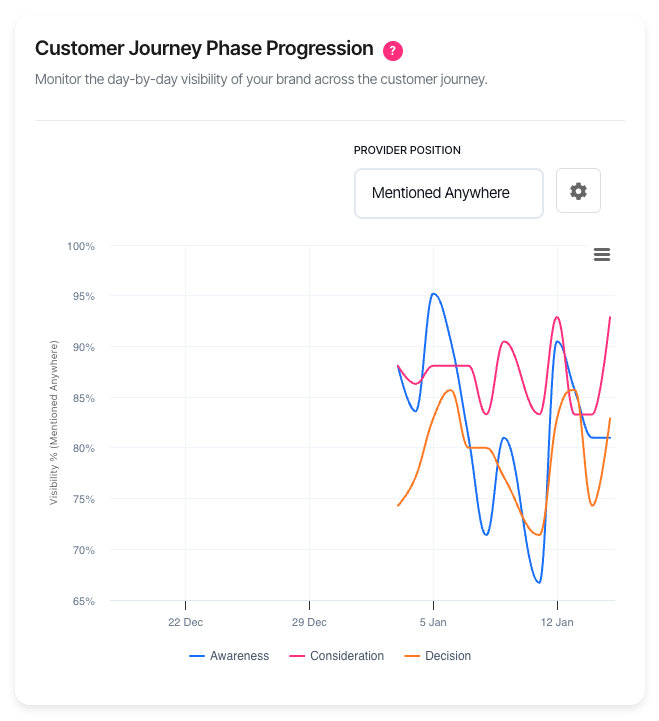
| Element | Description |
| X-axis | Dates across the selected period |
| Y-axis | Visibility percentage (0–100%) |
| Blue line | Awareness phase visibility |
| Pink line | Consideration phase visibility |
| Orange line | Decision phase visibility |
| Upward trend | Improving visibility over time |
| Downward trend | Declining visibility over time |
Snapshot view (under 7 days)
When the date range spans fewer than 7 days (such as Yesterday), the chart displays as a bar chart showing average visibility per phase:
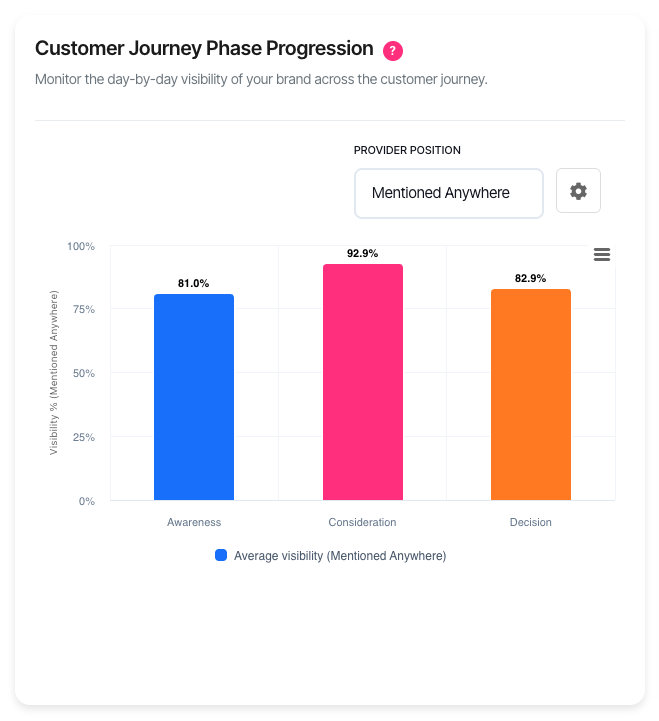
| Element | Description |
| X-axis | The three journey phases |
| Y-axis | Average visibility percentage |
| Coloured bars | One bar per phase showing the period average |
The snapshot view is useful for quick status checks. The time-series view is better for identifying trends over time.
Phase definitions
| Phase | When it occurs | AI response type |
| Awareness | User is learning about a problem or category | Educational content, problem definitions, general information |
| Consideration | User is evaluating options and solutions | Comparisons, feature lists, pros and cons |
| Decision | User is ready to choose or purchase | Specific recommendations, pricing, where to buy |
What should I do next?
Visibility patterns indicate where to focus effort:
| Pattern | Action |
| High Awareness, low Decision | Strengthen decision-stage content. Add pricing pages, comparison guides, and clear calls to action. |
| Low Awareness, high Decision | Build educational content. Create how-to guides and problem-focused articles. |
| Consistent decline across phases | Review recent content changes. Check competitor activity. |
| Single phase dropping | Focus content strategy on that specific buying stage. |
| Below 10% in any phase | Major content gaps exist. Prioritise that phase immediately. |
| Flat line at low visibility | Brand recognition is limited. Consider broader marketing efforts. |
Using the filters
Date range
The date range determines both the data period and the chart display mode:
| Option | Display mode | Best for |
| Yesterday | Bar chart (snapshot) | Daily status check |
| 7 Days | Line chart (trends) | Recent changes |
| 30 Days | Line chart (trends) | Trend analysis (default) |
| 90 Days | Line chart (trends) | Quarterly patterns |
| 180 Days | Line chart (trends) | Long-term trends |
Ranges under 7 days show a bar chart with average visibility per phase. Ranges of 7 days or more show a line chart with daily visibility trends.
Provider Position
This filter controls which brand mentions count towards visibility:
| Option | Counts mentions where |
| Mentioned Anywhere | Your brand appears anywhere in the AI response |
| Top 3 Recommendations | Your brand is among the first three mentioned |
| #1 Recommendation | Your brand is the first mentioned |
Stricter filters reveal competitive positioning. Being mentioned is good; being recommended first is better.
Platform
Filter by specific AI platform to compare performance across different systems. Select "All" to see aggregated visibility.
Phase filter
Focus the chart on a single journey phase. Useful when investigating specific stage performance without visual clutter from other lines.
Chart settings
Click the settings icon (⚙) to open the Chart Settings modal.
Group your brands
When enabled (default), visibility is measured whenever any of your configured brands appear. This gives an overall view of your organisation's AI presence.
When disabled, select up to 12 specific brands to track. This helps compare performance between product lines or sub-brands.
Brand selection
With grouping disabled, click brands from the "Add Brands" list to include them. Click the × on any selected brand to remove it. Changes apply when you click "Apply".
Session only: Brand selections are temporary and reset when you leave the page. Configure default brands in AI Visibility Settings to make them permanent.
Interactive features
• Hover over any point to see exact date, phase, and visibility percentage
• Click legend items to show or hide specific phase lines
• Export via the menu icon (⋮) to download as PNG, JPEG, or SVG
Troubleshooting
No data found
The selected filters may be too restrictive, or tracking has not started for this period.
• Expand the date range
• Select "All" for platform and phase filters
• Verify the project has active AI monitoring
Flat lines at zero
Your brands are not appearing in AI responses for this phase and period.
• Check AI Visibility Settings to confirm brands are configured correctly
• Verify brand names match how AI platforms reference your company
• Review competitor visibility to confirm tracking is working
Chart shows bars instead of lines
The chart has two display modes based on date range:
• Under 7 days: Bar chart showing average visibility per phase
• 7 days or more: Line chart showing daily visibility trends
This is expected behaviour. Short ranges lack enough data points for meaningful trend lines. Select 7 Days or longer to see the line chart.
Missing phase lines
Phases without data do not display. If a phase line is missing:
• Check the phase filter is set to "All"
• Click the legend item to ensure it is not hidden
• Expand the date range—some phases may have sparse data
FAQ
How is visibility calculated?
Visibility percentage equals brand mentions divided by total AI responses, multiplied by 100. For example, if your brand appears in 25 of 100 AI responses during the Decision phase, Decision visibility is 25%.
How often does data update?
Data updates daily. Exact timing depends on account configuration.
Why do I see different results with different Provider Position settings?
Stricter position filters (Top 3, #1) count fewer mentions. A brand mentioned fifth in a list counts for "Mentioned Anywhere" but not "Top 3 Recommendations". Use stricter filters to measure competitive positioning, looser filters for overall presence.
Can I track competitor visibility?
This chart focuses on your brands. Use the Share of Voice or Win Rate reports for competitive analysis.
Why does visibility vary between AI platforms?
Each AI platform has different training data, response patterns, and update cycles. Variations are expected. Focus on trends rather than absolute numbers when comparing platforms.
What does "Session only" mean for brand selection?
Brand selections made in Chart Settings apply only to the current browser session. Closing the page or navigating away resets to your configured defaults. To set permanent defaults, configure them in Brand and Competitors Tool Settings.
Getting help
Contact support for data issues or unexpected behaviour