Keyword Average Position
The Average Position Chart helps you track how your website ranks in search engines over time. Think of it as your SEO performance dashboard – it shows you where you stand today, how you've improved (or declined), and where your biggest opportunities lie.
Getting Started
Accessing the Chart
- Navigate to Keywords Dashboard in SERP360
- Look for the Average Position Chart section
- The chart displays automatically once you select your filters
Understanding the Display
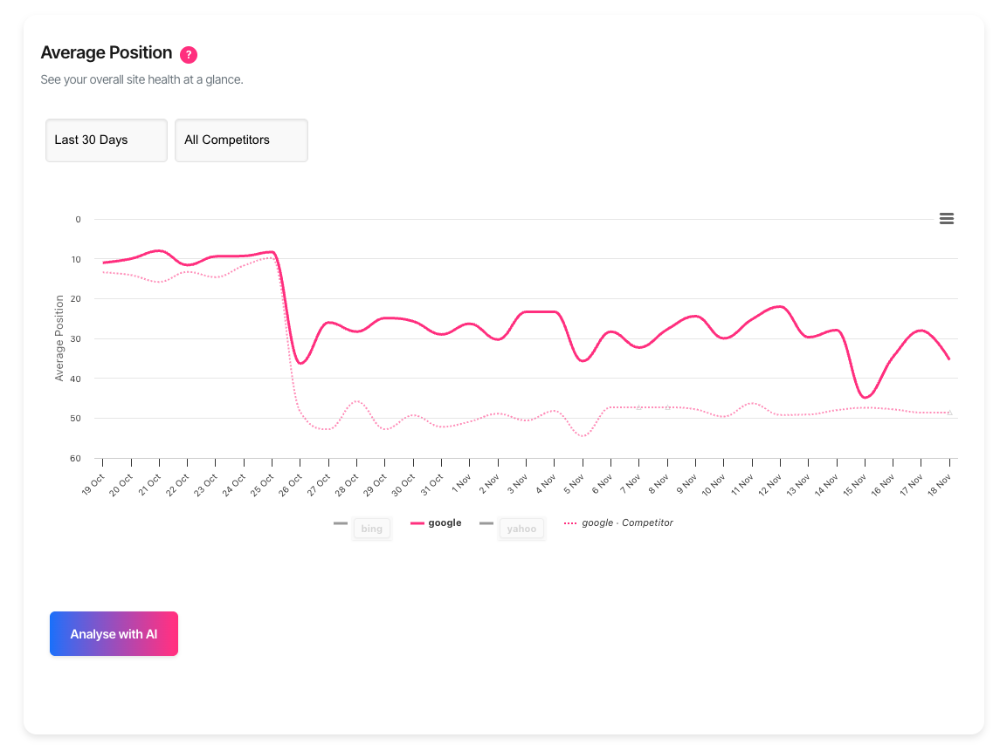
The chart uses a line graph where:
- Lower positions are better (position 1 is the top of search results)
- Each line represents a search engine (Google, Bing, etc.)
- Dotted lines show competitor performance (when analysed)
- Solid lines show your performance
Using the Filters
1. Date Range Selector
Control the time period you're analysing:
- 1 Day: Today's snapshot
- 7 Days: Last week's performance
- 30 Days: Last month (default)
- All Time: Your complete history
Why it matters: Shorter periods show daily fluctuations; longer periods reveal trends.
2. Search Group Filter
Select which website or project you want to analyse:
- Choose from your configured search groups
- Each search group typically represents one website or domain
- Only keywords tracked for that group will appear
3. Category Filter
Narrow your analysis to specific keyword groups:
- All Categories: See everything
- Specific Category: Focus on one topic (e.g., "Product Pages", "Blog Posts")
Example: If you run an e-commerce site, you might have categories for "Product Names", "Category Pages", and "How-to Guides".
4. Competitor Filter
Compare your performance against specific competitors:
- All Competitors: See aggregate competitor data
- Specific Competitor: Focus on one rival domain
Reading the Chart
The Lines
Your Performance (Solid Lines)
- Thicker, solid lines show your ranking positions
- Each colour represents a different search engine
- Google is shown by default (other engines can be toggled on/off)
Competitor Performance (Dotted Lines)
- Thinner, dotted lines show competitor rankings
- Slightly faded to distinguish from your data
- Labelled with "· Competitor" in the legend
The Position Axis (Vertical)
- Reversed scale: Lower numbers (top of chart) = better rankings
- Position 1 = Top of search results
- Position 10 = Bottom of first page
- Position 20+ = Second page or beyond
The Date Axis (Horizontal)
- Shows your selected date range
- Daily data points connected by lines
- Small dots on the line indicate "carried forward" data (days where no new ranking was recorded, so the previous value is shown)
Interactive Features
Hover for Details
- Move your cursor over any point on the chart
- See exact date, position, and search engine
- Compare your position vs competitors at that moment
Legend Controls
- Click any search engine name to show/hide that line
- Greyed out items are hidden
- Useful for focusing on specific engines or clearing clutter
Expand/Collapse
- Use the chevron (▼/▲) next to "Detailed Analysis" to show or hide additional data
- Keeps your view clean when you only need the chart
Understanding the AI Analysis
Triggering the Analysis
- Set your filters (date range, search group, category, competitor)
- Click the AI Analysis button
- Wait for the system to analyse your data (usually 10-30 seconds)
- Results appear below the chart
What the AI Provides
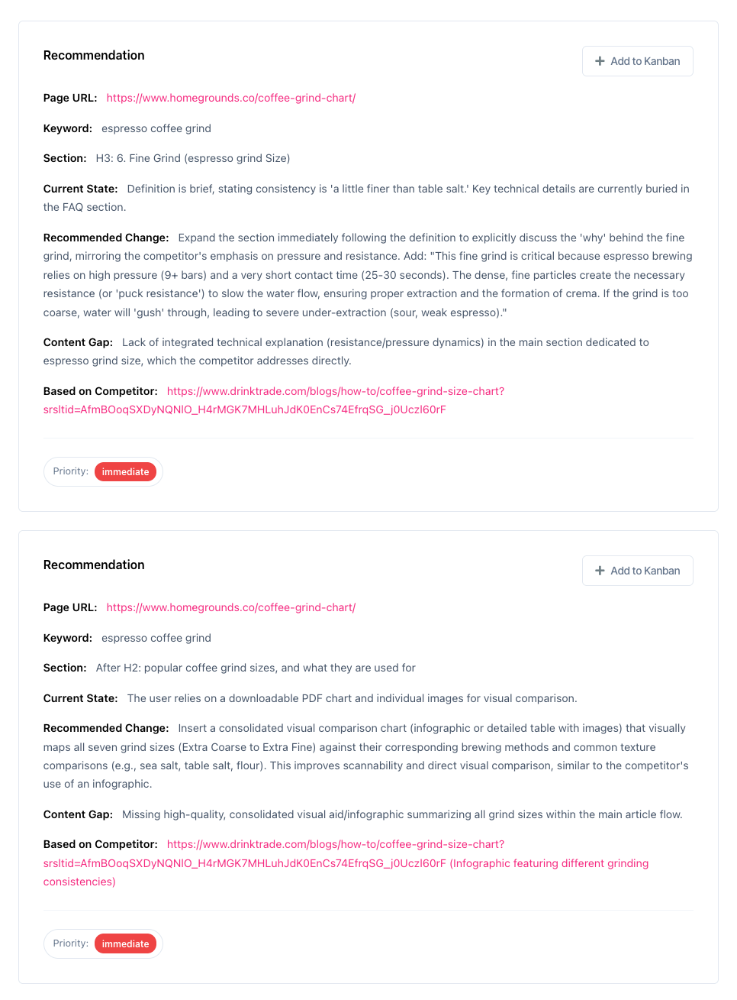
1. Recommendations (Primary Section)
This is the most important part – specific, actionable suggestions:
- Keyword: Which search term needs attention
- Page URL: Which page to edit
- Section: Where on the page to make changes
- Current State: What's there now
- Recommended Change: Exactly what to add or change
- Priority: When to do it (Immediate, Near-term, Can-wait)
- Content Gap: What your competitors have that you're missing
Example Recommendation:
2. High-Volume Keywords
Shows keywords with the most monthly searches – your biggest opportunities.
3. Significant Position Changes
Keywords that moved up or down by 5+ positions – indicating momentum or problems.
4. Competitive Gap Keywords
Where you rank poorly while competitors rank well – your weakest spots.
5. Non-Ranking Opportunities
Keywords you're not ranking for at all, but should be targeting.
Taking Action
Adding Recommendations to Your Kanban Board
- Find a recommendation you want to action
- Click the "+ Add to Kanban" button on that recommendation
- Select which project board to add it to
- The task is created with all details pre-filled
- The button changes to a checkmark (✓) to show it's been added
Why use Kanban?
- Organises your SEO work into manageable tasks
- Tracks what's done, in progress, or still to do
- Shares work across your team
Prioritising Your Work
Immediate Priority
- Large ranking gaps (15+ positions behind competitors)
- High-volume keywords (1,000+ monthly searches)
- Action within 1-2 weeks
Near-Term Priority
- Moderate gaps (5-14 positions)
- Medium-volume keywords (500+ monthly searches)
- Volatile rankings (changing frequently)
- Action within 1-2 months
Can-Wait Priority
- Small gaps (<5 positions)
- Lower-volume keywords (<500 monthly searches)
- Action when time permits
Advanced Features
Content Selection Context
When the AI analyses your content, it explains which keyword and page it focused on:
- Shows the selected keyword
- Displays monthly search volume
- Indicates which search engine was used
- States your current average position
This helps you understand why certain recommendations were made.
Competitor Insights
If competitor data is available, you'll see:
- Competitors Analysed: Which sites were examined
- Common Advantages: What multiple competitors do better
- Unique Strengths: Special features of individual competitors
- Competitive Landscape: Overall market positioning
Exporting Your Data
- Scroll to any analysis section
- Click the export button (document icon)
- A text file (.txt) downloads with all analysis content
- Use this for team meetings, reports, or archiving
Troubleshooting
"No Data Found"
Possible causes:
- No keywords tracked for the selected filters
- Selected date range has no ranking data
- Search group not properly configured
Solutions:
- Adjust your date range
- Check if keywords are being tracked for this search group
- Verify category assignments
"No Competitor Data Available"
Possible causes:
- Competitor hasn't ranked for your keywords recently
- Competitor filter doesn't match tracked domains
Solutions:
- Try "All Competitors" filter
- Check if competitor tracking is enabled
- The AI will still provide user-focused optimisation recommendations
Chart Shows Flat Lines
Possible causes:
- Rankings haven't changed (good or bad!)
- Small dots on the line = "carried forward" data (no fresh rankings)
Solutions:
- This is informational, not an error
- Check if your rank-checking schedule is running
- Stable rankings aren't necessarily bad
AI Analysis Takes Too Long
If loading exceeds 60 seconds:
- Refresh the page
- Try a shorter date range (7 days instead of 30)
- Check if your category has too many keywords
Frequently Asked Questions
Why is position 1 at the top of the chart?
Search rankings are reversed – position 1 is the best position (top of Google), so the chart shows it at the top. This is standard practice in SEO tools.
Can I compare multiple competitors at once?
Yes – select "All Competitors" in the filter. You'll see aggregated competitor performance as a dotted line.
How often is ranking data updated?
Ranking checks typically run daily. The exact schedule depends on your account configuration and the number of keywords being tracked.
Why do some keywords have no competitor data?
Competitors must be actively ranking for the same keyword. If they've dropped off the first few pages, or if the keyword is very niche, competitor data may not be available.
What does "carried forward" mean?
When a small dot appears on the chart line, it means no new ranking was recorded that day, so the previous day's position is shown. This prevents gaps in the chart.
Can I export the chart as an image?
Yes – use the export menu (three-dot icon) in the top-right corner of the chart. You can download as PNG, JPEG, or SVG.
How does the AI select which keywords to analyse?
The AI prioritises:
- Large position gaps vs competitors
- High search volumes
- Significant ranking changes (±5 positions)
- Non-ranking high-volume opportunities
You'll typically see 8-10 strategic examples rather than every keyword.
Why are my recommendations different from my colleague's?
Recommendations are personalised based on:
- Your selected filters (date range, category, competitor)
- Recent ranking changes
- Content gaps identified on your specific pages
- Timing of the analysis (data updates daily)
Getting Help
If you encounter issues or need guidance:
- Check the analysis notes in the AI response – they often explain data limitations
- Adjust your filters – sometimes narrowing or broadening the scope helps
- Contact support – our team can help troubleshoot specific data issues
- Review this guide – many questions are answered in the sections above